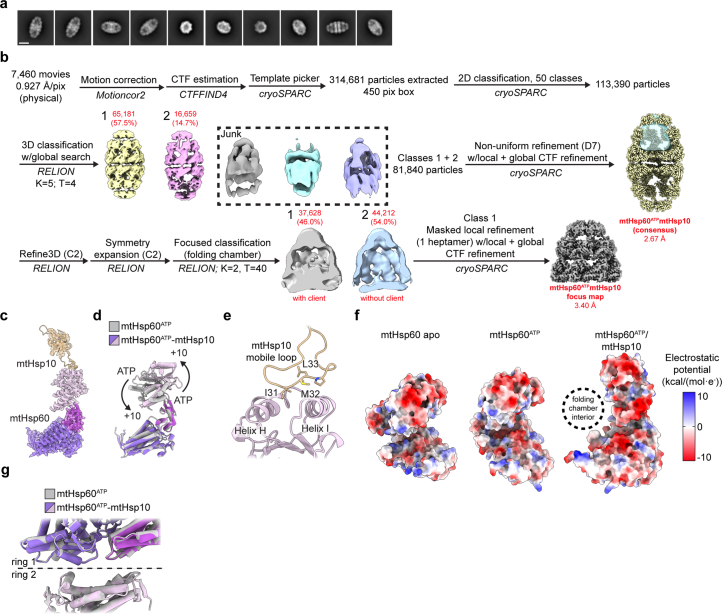
Extended Data Fig. 4. Cryo-EM analysis of ATP/mtHsp10-bound mtHsp60V72I.
(a) Representative 2D class averages from the mtHsp60ATP-mtHsp10 dataset. Scale bar equals 100 Å. (b) Cryo-EM processing workflow for structures obtained from the mtHsp60ATP-mtHsp10 dataset. The mask used for subsequent focused classification is shown (transparent blue) on the consensus D7 refinement. (c) Sharpened map and model for the asymmetric unit of the mtHsp60ATP-mtHsp10 consensus structure. (d) Overlay of consensus models for mtHsp60ATP and mtHsp60ATP-mtHsp10 structures, showing identical equatorial and intermediate domain conformations but a large upward apical domain rotation. (e) Model of the mtHsp10 mobile loop and associated mtHsp60 apical domain in the mtHsp60ATP-mtHsp10 consensus map, showing interaction of conserved hydrophobic residues with apical domain helices H and I. (f) Coulombic potential maps of protomers of mtHsp60 apo, mtHsp60ATP, and mtHsp60ATP-mtHsp10 consensus structures, showing increased negative charge in the inward-facing regions of mtHsp60ATP-mtHsp10. (g) Overlay of consensus models for mtHsp60ATP and mtHsp60ATP-mtHsp10 structures, showing highly similar inter-ring conformations.

