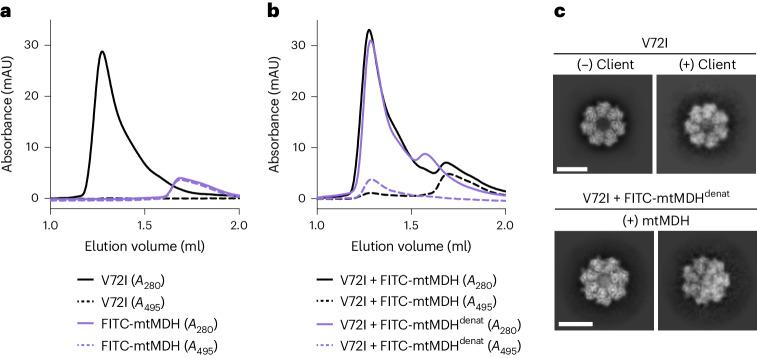
Fig. 5. Analysis of the mtHsp60–mtMDH client complex.
a, Analytical SEC traces of mtHsp60V72I (black) and folded FITC-mtMDH (purple). Solid lines are the A280 traces and dashed lines are the A495 traces. This experiment was repeated a total of three times with similar results. b, As in a, but for V72I incubated with folded FITC-mtMDH (black) or guanidine-denatured FITC-mtMDH (purple). Note the minimal coelution of mtHsp60 with folded FITC-mtMDH, compared with quantitative coelution with denatured FITC-mtMDH. This experiment was repeated a total of three times with similar results. c, Selected 2D top view class averages from the mtHsp60apo dataset (upper), showing classes with no or weak client density, and from the dataset with denatured FITC-mtMDH added (lower), showing much stronger client density. Scale bars, 100 Å. mAU, milli-absorbance unit.

