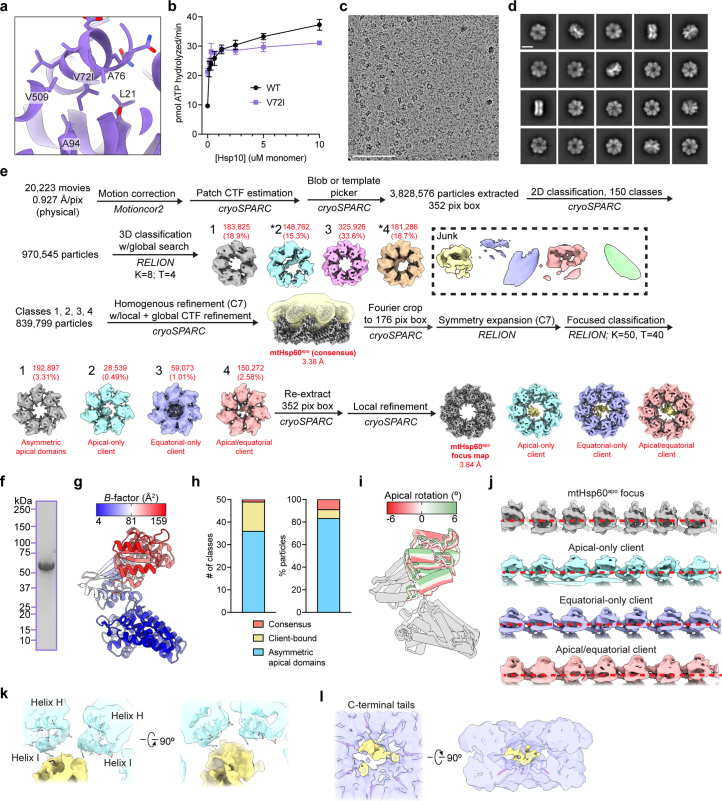
Extended Data Fig. 1. Biochemical and cryo-EM analysis of apo mtHsp60V72I.
(a) View of V72I mutation in mtHsp60apo, colored as in Fig. 1a. Adjacent hydrophobic residues are also labeled. (b) Steady-state ATPase activity of mtHsp60 (black) and mtHsp60V72I (purple) as a function of mtHsp10 concentration. A representative experiment of three biological replicates is shown. Data are presented as mean ± s.d. (c) Representative micrograph from the mtHsp60apo dataset. Scale bar equals 100 nm. (d) Representative 2D class averages from the mtHsp60apo dataset. Scale bar equals 100 Å. (e) Cryo-EM processing workflow for structures obtained from the mtHsp60apo dataset. The mask used for focused classification is shown in transparent yellow with the consensus map. Client-containing maps from the initial 3D classification are indicated (*). (f) Coomassie Brilliant Blue-stained SDS-PAGE gel of recombinant mtHsp60V72I, showing no strong additional bands corresponding to other proteins. This experiment was repeated a total of two times with similar results. (g) Protomer of mtHsp60apo consensus colored by B-factor. (h) Class distributions of the mtHsp60apo focused classification job, shown by number of classes (left) and number of particles (right). Resulting classes either had asymmetric apical domain conformations with improved map quality (blue, relative to the consensus structure) or client density in the central cavity (yellow). One class (salmon), representing ~9% of the data, resembles the consensus state and likely represents particles that were not classified correctly (that is, an artifact). (i) Overlay of mtHsp60apo focus protomers, with apical domains colored as in Fig. 1i. (j) Unwrapped views of unsharpened mtHsp60apo focus and client-bound maps, showing apical domain asymmetry and client density (where applicable). Horizontal red dashed lines are for clarity. (k) Enlarged view of apical domain helices H and I from the mtHsp60apo apical-only client map. (l) Enlarged view of resolved portions of C-terminal tails from the mtHsp60apo equatorial-only client map.

