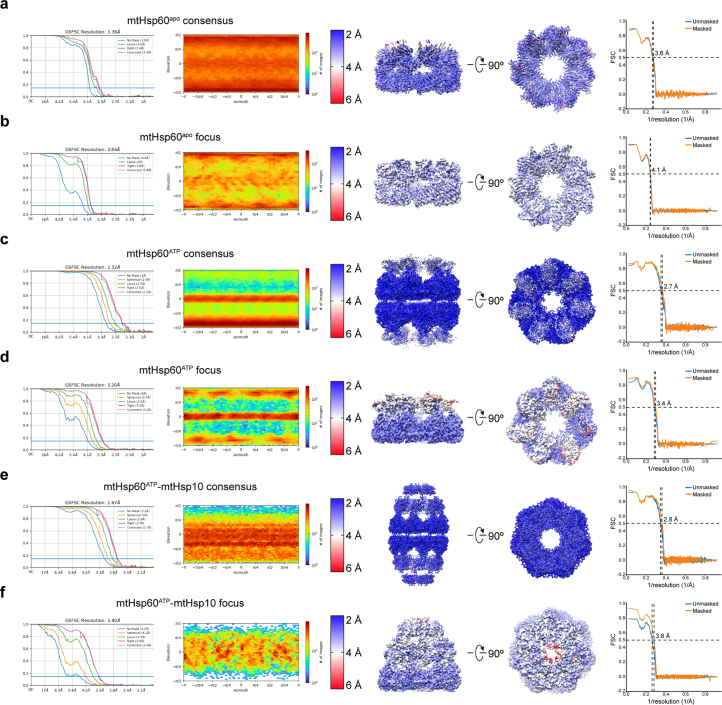
Extended Data Fig. 2. Cryo-EM densities and resolution estimation from the mtHsp60V72I datasets.
(a to f) Fourier Shell Correlation (FSC) curves, orientation distribution plots, sharpened maps colored by local resolution (0.143 cutoff), and map-model FSC curves for (a) mtHsp60apo consensus, (b) mtHsp60apo focus, (c) mtHsp60ATP consensus, (d) mtHsp60ATP focus, (e) mtHsp60ATP-mtHsp10 consensus, and (f) mtHsp60ATP-mtHsp10 focus structures. Displayed model resolutions for map-model FSC plots were determined using the masked map.

