Figure 2.

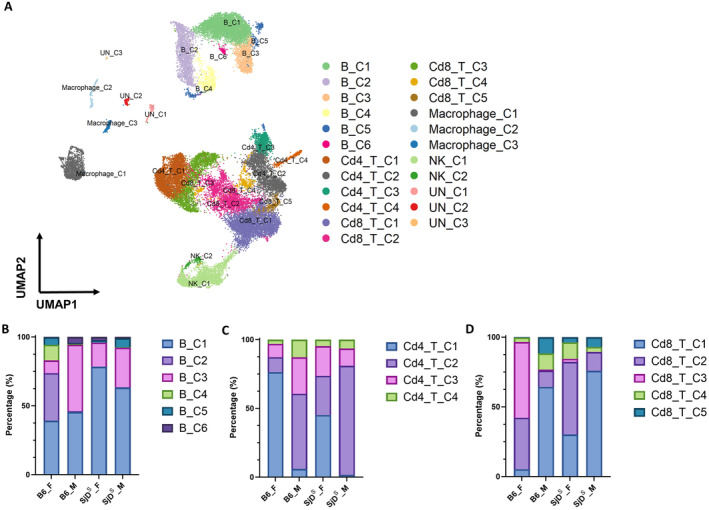
Cellular heterogeneity of salivary gland immune cells. (A) UMAP plots of immune cells show associated cell subpopulations. (B) Proportion of B cell subpopulations of male and female B6 and SjDS mice is shown. Six subpopulations were found in B cells and are indicated by different colors. (C) Proportion of CD4+ T cells subpopulations of male and female B6 and SjDS mice is shown. Four subpopulations were found in CD4+ T cells and are indicated by different colors. (D) Proportion of CD8+ T cell subpopulations of male and female B6 and SjDS mice is shown. Five subpopulations were found in CD8+ T cells and are indicated by different colors. B6, C57BL/6; F, female; M, male; NK, natural killer; SjDS, Sjögren disease–susceptible; UMAP: Uniform Manifold Approximation and Projection; UN: Unknown.
