Figure 3.

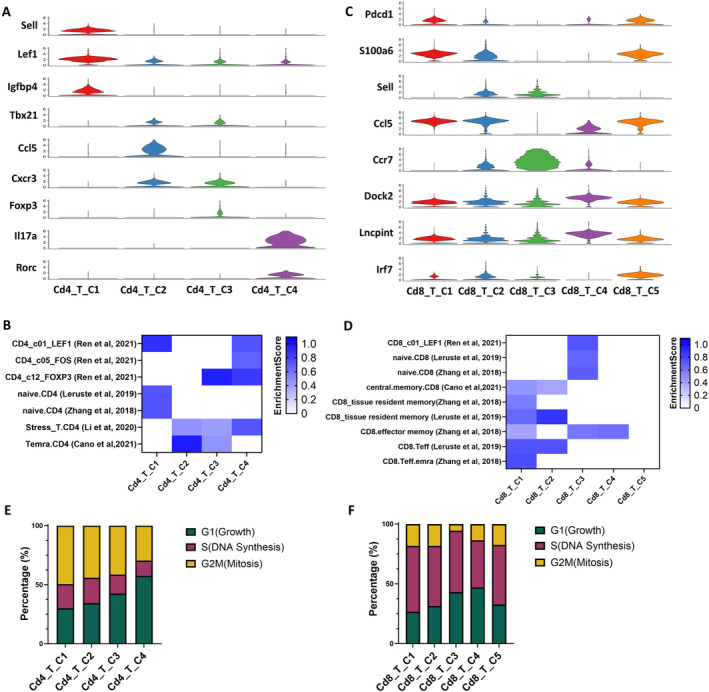
Cluster features of CD4+ and CD8+ T cell subsets in the salivary glands of SjD mice. (A) Violin plots show expression levels of selected marker genes in four different subpopulations of CD4+ T cells: naive T cells (Sell, Lef1, Igfbp4), Th1 (Tbx21, Ccl5, Cxcr3), Treg (Foxp3), and Th17 (Il17a, Rorc). (B) Gene enrichment of functional CD4+ T cell subsets in subpopulations of CD4+ T cells converted from published datasets is shown. 53 , 54 , 55 , 56 , 57 The enrichment scores are shown in heatmap with different color densities. (C) Violin plots show expression levels of selected marker genes in five different subpopulations of CD8+ T cells. Sell was selected as a naive T cell marker, with Ccl5 and Ccr7 expressed differently in naive Cd8_T_C2 and naive Cd8_T_C3 clusters. Pdcd1 was selected as an exhausted T cell marker, with Isg15 expressed in exhausted Cd8_T_C1 (low expression) and exhausted Cd8_T_C5 cluster (high expression). Cd8_T_C4 was a unique Cd8 T cell subcluster with Dock2 and Lncpint highly expressed. (D) Gene enrichment of functional CD8+ T cell subsets in subpopulations of CD8+ T cells converted from published datasets is shown 53 , 54 , 56 , 57 ; enrichment scores are shown in heatmap with different color densities. (E) Proportion of cells in CD4+ T cell subpopulations undergoing each cell cycle phase is shown. Cd4_T_C4 has the least fraction of cells undergoing mitosis (29.6%). (F) Proportion of cells in CD8+ T cell subpopulations undergoing each cell cycle phase is shown. SjD, Sjögren disease; Teff, T effector; TEMRA, effector memory T cells re‐expressing Cd45RA; Treg, regulatory T.
