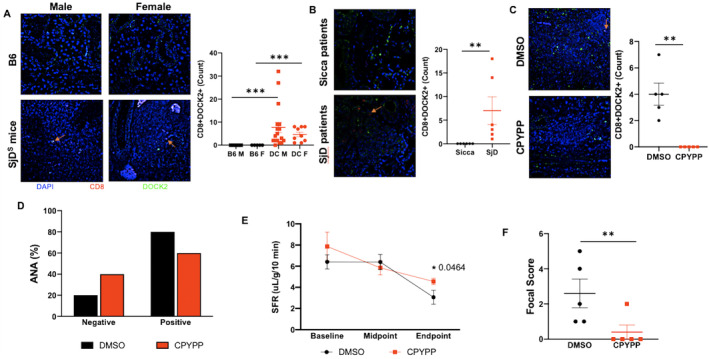
Figure 6.

DOCK2 expression and clinical impact of DOCK2 inhibitor in SjD. (A) Immunofluorescent staining was performed for CD8 (red) and DOCK2 (green) with a DAPI counterstain (blue). Images include salivary glands of B6 and SjDS mice. (B and C) Labial salivary gland biopsies from Sjögren's International Collaborative Clinical Alliance control and patients with SjD (B) and DMSO‐ or CPYPP‐treated mice (C) are shown, with representative 400× images provided for each group. A single arrow per relevant image is provided to indicate the CD8+DOCK2+ cells. Enumeration of CD8+DOCK2+ cells in the infiltrates was determined using ROI thresholding in NIS Elements (Nikon), for which Mann‐Whitney t‐test was performed. (D) Percentage of mice positive or negative for ANA is given, with black indicating DMSO‐treated and red CPYPP‐treated mice (n = 5 per group). Chi‐squared test was performed, and although P = 0.490153, there is a shift toward improvement. (E) SFRs at baseline, midpoint, and endpoint are given, with black indicating DMSO‐treated and red CPYPP‐treated mice (n = 5 per group). Welch's one‐tailed t‐test was performed with *P = 0.0464. (F) Focal scores were counted if there were ≥50 lymphocytes in the whole salivary gland. Mann‐Whitney one‐tailed t‐test indicate *P = 0.0159. ANA, antinuclear antibody; B6, C57BL/6; CPYPP, 4‐[3‐(2‐Chlorophenyl)‐2‐propen‐1‐phenyl‐3,5‐pyrazolidinedione; DOCK2, dedicator of cytokinesis 2; F, female; M, male; ROI, region of interest; SFR, salivary flow rate; SjD, Sjögren disease; SjDS, Sjögren disease–susceptible.
