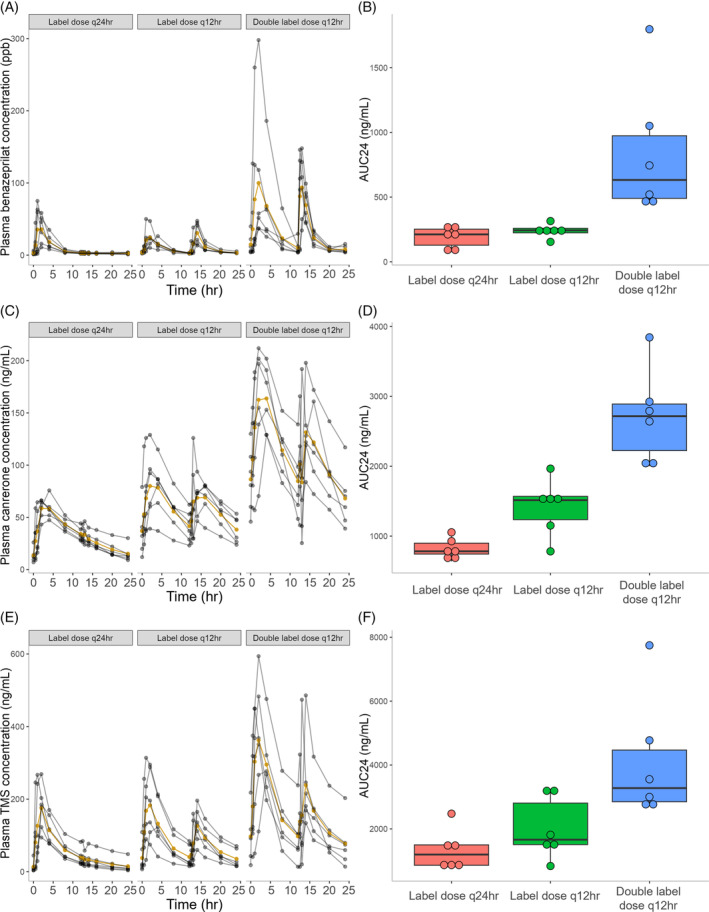
FIGURE 2.

Time‐course of benazeprilat (A), canrenone (C), and 7‐alpha‐thiomethylspironolactone (TMS; E) plasma concentrations in 18 healthy dogs after the final dose of CARDALIS® administered at 3 different doses for 14 days (n = 6 dogs in each dosage group). The yellow line indicates mean plasma concentration and gray lines indicate individual dog results at each timepoint. Corresponding box‐and‐whisker plots indicate 24‐hour area under the curve of benazeprilat (B), canrenone (D), and TMS (F) concentration (ng/mL for all metabolites). The horizontal line represents median, box represents quartiles, and whiskers represent range, with outliers (>1.5 × interquartile range below Q1 or above Q3) plotted as dots. CARDALIS® dosage groups: Label dose q24h (benazepril 0.25 mg/kg + spironolactone 2 mg/kg PO q24h); label dose q12h (benazepril 0.25 mg/kg + spironolactone 2 mg/kg PO q12h); and double label dose q12h (0.5 mg/kg benazepril + 4 mg/kg spironolactone PO q12h).
