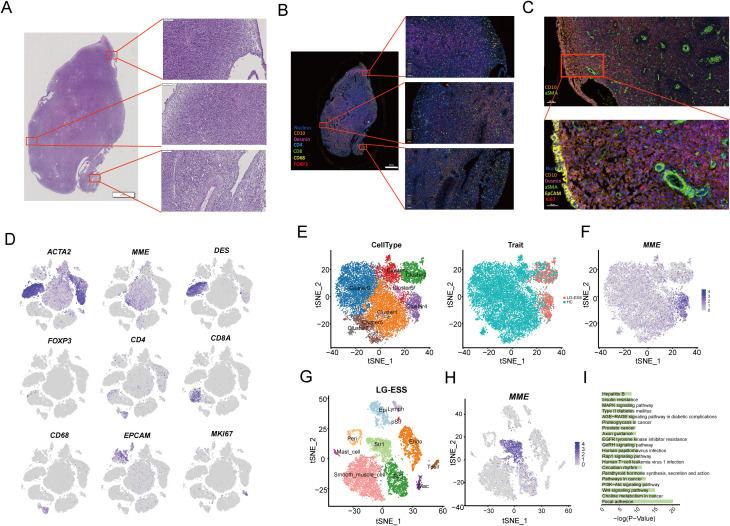
Figure 2.
Characterization and functional analysis of LG-ESS tumor cell subpopulations. (A) H&E staining result of the LG-ESS tissue sample, highlighting the overall tissue architecture at low magnification, with higher magnification images of selected regions showing cellular morphology. (B, C) miF staining result of LG-ESS sample. CD10, desmin, and other markers are used to distinguish different cell populations within the tumor, with magnified views focusing on specific regions of interest. The scale in figure (B) represents 2 mm and 100 µm, while in figure (C) it represents 100 µm and 30 µm. (D). Expression of key marker genes from the single-cell RNA sequencing data corresponding to the same LG-ESS sample. These markers (e.g., ACTA2, MME, DES, FOXP3, CD4, CD8A) help identify distinct cell types within the tumor microenvironment. (E) t-SNE plots showing the clustering of cell subpopulations (left) in the LG-ESS sample and their distribution in HC and LG-ESS tissue (right). (F) Featureplot demonstrating the expression of the CD10 (MME) gene in different subgroups of Str. (G) t-SNE plot highlighting the main cell types present in LG-ESS, identified by distinct colors. (H) MME expression across all cell types in the LG-ESS sample, with Str1 cells showing prominent expression. (I) Results of KEGG enrichment analysis of genes highly expressed in Str1.

