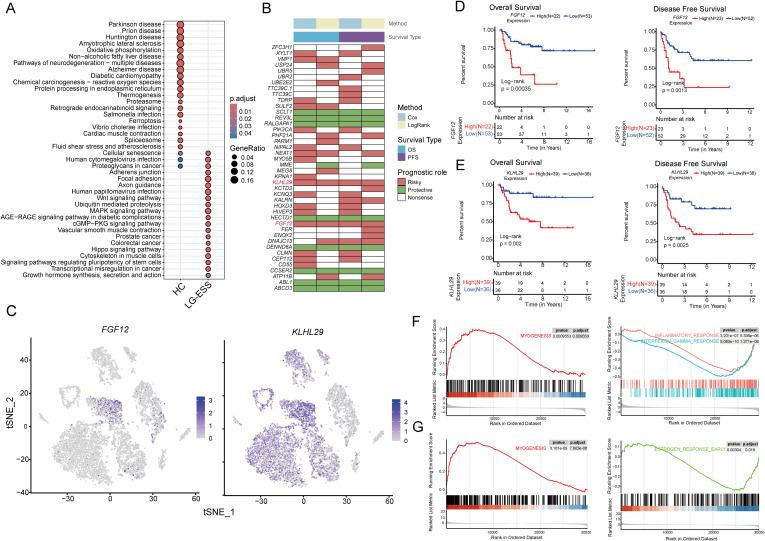
Figure 4.
FGF12 and KLHL29 expression correlates with poor prognosis and tumor progression in ESS. (A) Scatterplot demonstrating the results of KEGG enrichment analysis of differentially expressed genes of Str1 between LG-ESS and HC. (B) Heatmap demonstrating the results of Cox regression analysis and survival analysis for specific genes based on bulk transcriptome data of ESS patients. (C) Featureplot demonstrating the expression of FGF12 and KLHL29 genes in different cellular subpopulations of LG-ESS. (D, E) Results of survival analysis based on FGF12 (D) and KLHL29 (E) expression in ESS patients, with overall survival on the left and progression-free survival on the right (GSE128630). (F, G) Results of GSEA enrichment analysis after differentiating patients into high and low expression groups based on FGF12 (F) and KLHL29 (G) gene expression in ESS patients, with significantly activated pathways in the high expression group on the left and significantly inhibited pathways on the right.

