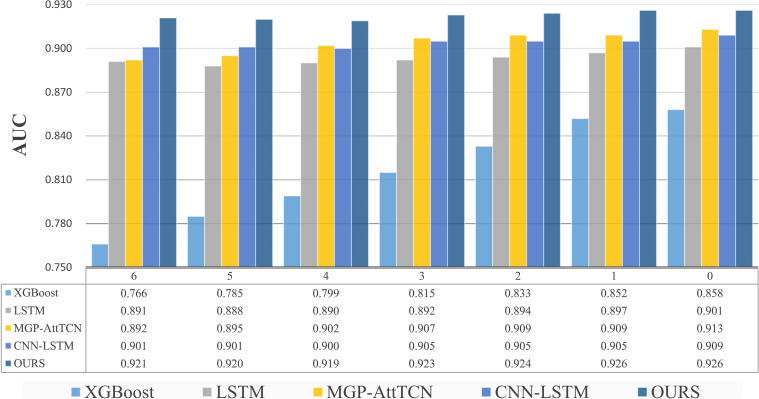
Figure 3.
Results of comparative experiments several hours before the onset of sepsis. The ordinate of the upper bar chart represents the value of the indicator AUC, and the abscissa represents the task moment several hours before the onset of sepsis. Below is the specific data table, our method is better than the comparison methods.

