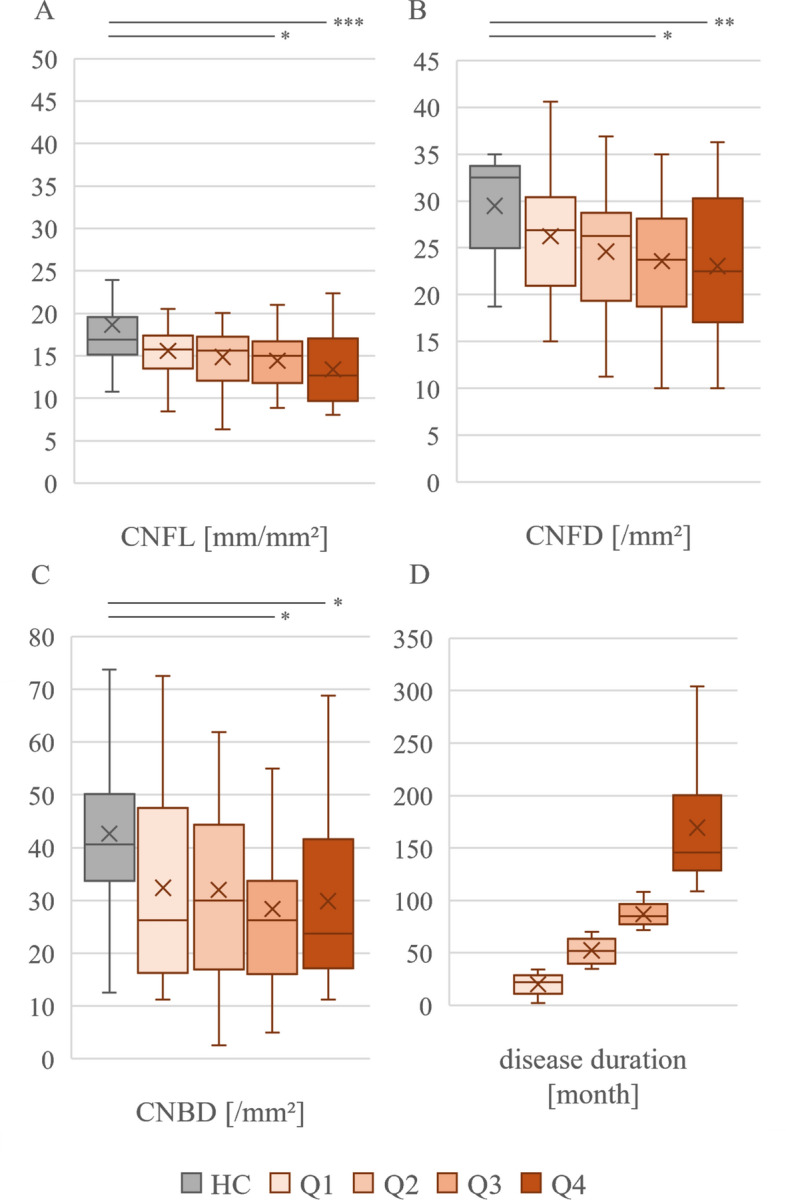
Fig. 2.

Comparison of different disease stages of all CIDP (Q1–Q4; n = 25/group) patients with HC (n = 31). Values are displayed as mean ± SD. Comparison was performed using Kruskal Wallis test with Bonferonni correction. A: Significant reduction of CNFL in Q3 (14.4 ± 3.0; p = 0.025) and Q4 (13.4 ± 4.1; p = 0.001) compared to HC (18.6 ± 6.9). B: Significant reduction of CNFD in Q3 (23.6 ± 5.9; p < 0.022) and Q4 (23.0 ± 7.6; p = 0.007) compared to HC (29.5 ± 4.9). C: Significant reduction of CNBD in Q3 (28.4 ± 18.0; p < 0.001) and Q4 (29.9 ± 17.1; p = 0.005) compared to HC = 42.7 ± 18.8. D: Disease durations since first manifestation in month mean ± SD. Q1 = 20 ± 10; Q2 = 53 ± 15; Q3 = 87 ± 11; Q4 = 169 ± 58
