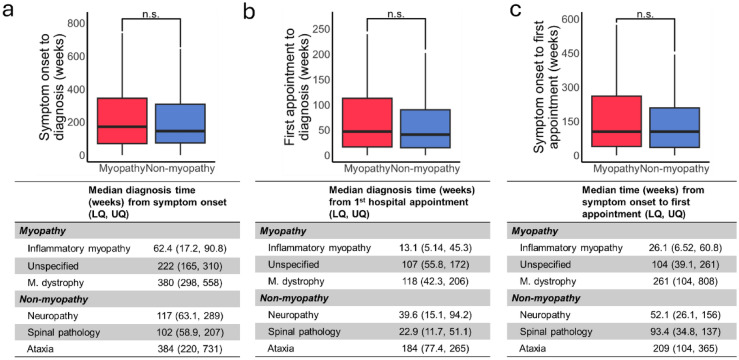
Fig. 3.
The times from symptom onset to diagnosis. a. Time from symptom onset to first hospital appointment was similar in both groups. The mean time for the top three diagnoses in each category is tabulated. b. The time from symptom onset to the final diagnosis was similar in both the groups. c. The time from first hospital appointment onset to the final diagnosis both from the first hospital consultant and symptom onset. LQ lower quartile, UQ upper quartile

