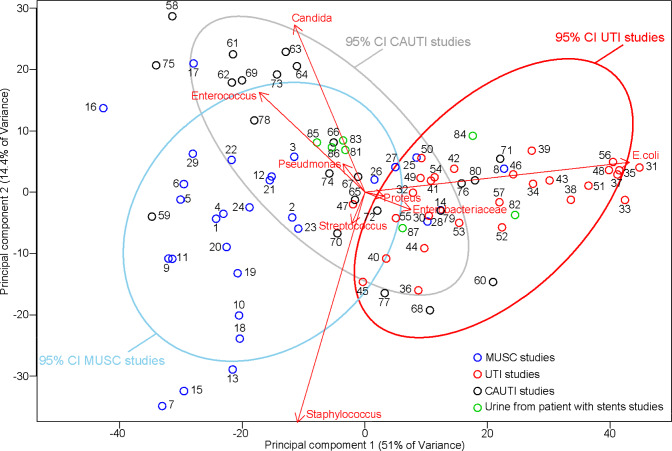
Fig. 2.
Principal component analysis showing the grouping of UTI, stent colonization and CAUTI studies. Each point represents a study with the specific pathogen spectrum described in this study (numbers correspond to the number of the study see supplementary material for details); red UTI studies, blue stent colonization studies, grey CAUTI studies. Arrows show the projections of the original features on to the principal components. 95% confidence interval ellipses were also drawn for each group. With the use of the ellipses, the grouping of the different samples in the PCA projection can be observed. Such ellipses allow understanding which data deviate from the groups formed in this PCA projection

