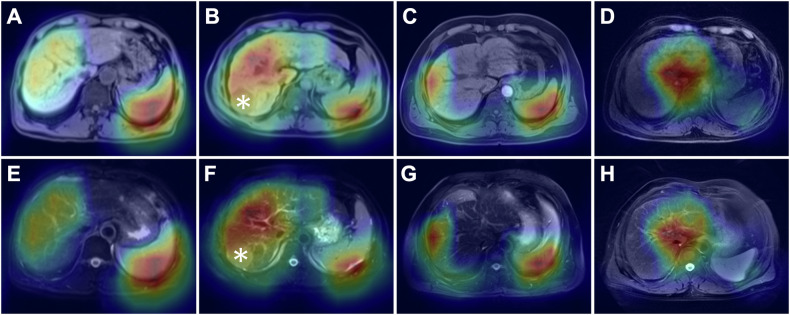
Fig. 4.
Representative activation maps overlaid on pre-contrast T1-weighted (A–D) and T2-weighted (E–H) axial images in patients with cirrhosis who were correctly classified by the CNN model. The liver parenchyma, liver surface, portal hepatis, and spleen are highlighted in these maps, which indicates that information from these areas contributes to the prediction of cirrhosis. Note the hepatocellular carcinoma lesions in the liver (B, F, asterisk). CNN, convolutional neural network

