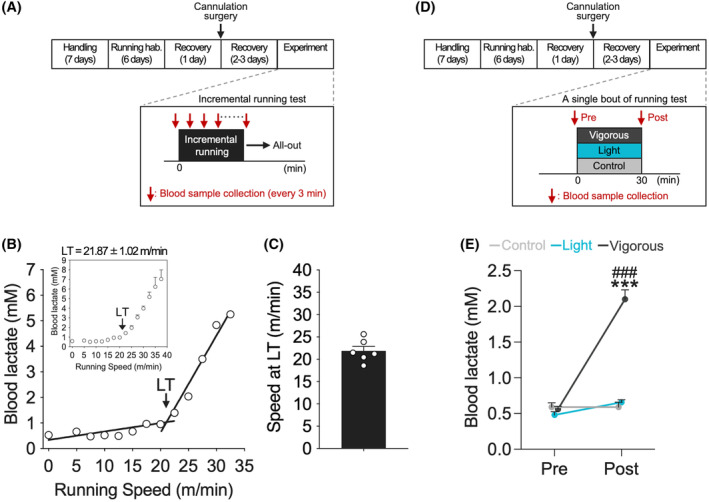
FIGURE 1.

Measurement of lactate threshold and validation of exercise intensity. (A) Experimental design for incremental running test. (B) A representative LT profile from the incremental running test. (C) Speed of rats at LT was 21.87 ± 1.02 m/min (n = 6). (D) Experimental design for a single bout of running test. We defined 15 m/min for light‐intensity running and 25 m/min for vigorous‐intensity running. (E) Blood lactate concentration was increased only after a 30‐min session of vigorous‐intensity running. All data are expressed as mean ± SEM. The graph data with SD bars is shown in the supplemental data (Figure S1). Mean, SD, and SEM for each point are available in the supplemental data (Table S1). ***p < .001 vs. Control, ### p < .001 vs. Light, n = 5‐7/group. Control: Sedentary control; Light: 15 m/min running; Vigorous: 25 m/min running; hab.: Habituation.
