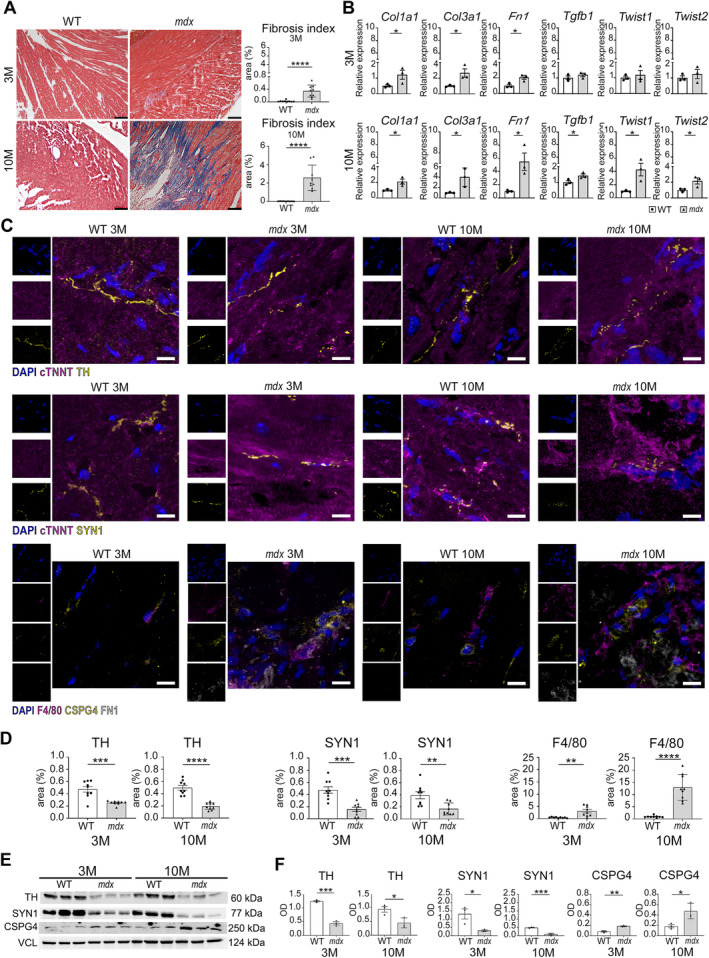
Figure 1.

Cardiac fibrosis and innervation. (A) Masson's trichrome staining of young (3‐month‐old) and old (10‐month‐old) WT and mdx mouse hearts. Scale bars, 100 μm. The graph shows the area as a percentage of the fibrosis index (fibrotic area/whole area). N = 3 biological replicates. (B) qPCR for fibrosis‐related transcripts in 3‐ and 10‐month‐old mdx and WT hearts (Col1a1, Col3a1, Fn1, Tgfb1, Twist 1, Twist 2). N = 3 biological replicates. (C) Confocal images for tyrosine hydroxylase (TH), Synapsin 1 (SYN1), MPs (F4/80), proteoglycan CSPG4, and fibronectin 1 (FN1) on myocardium sections of 3‐ and 10‐month‐old mice. The markers TH, SYN1, and CSPG4 are labeled in yellow, cardiac troponin (cTNNT) and F4/80 are in magenta, while FN1 is in white. Scale bars, 10 μm. Nuclei are counterstained with DAPI in blue. (D) Charts indicate positive area expressed as percentage of TH, SYN1, and F4/80 on whole area. N = 3 sections per N = 3 biological replicates. (E and F) Western blot analysis of TH, SYN1, and CSPG4 in mdx and WT hearts of young and old mice. Graphs show optical density (OD) of protein bands normalized to vinculin (VCL). N = 3 biological replicates. Error bars show SEM. *p < 0.05, **p < 0.01, ***p < 0.001, ****p < 0.0001 were calculated using Student's t‐test.
