Figure 2.

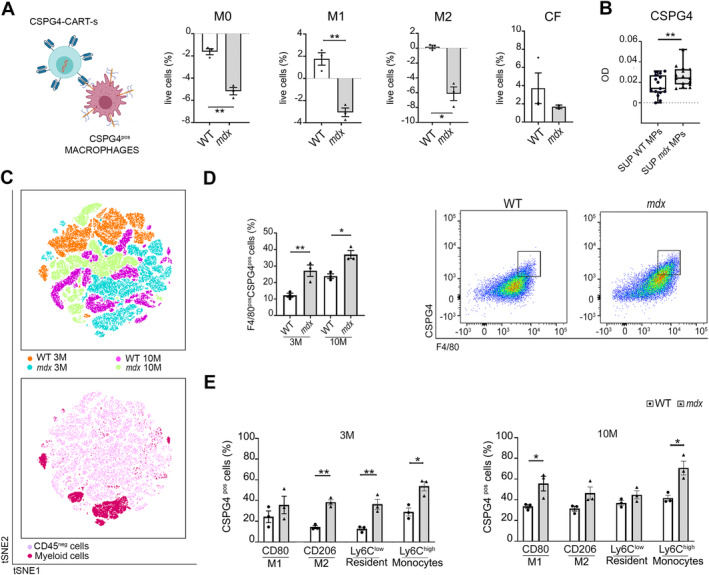
MPs as main producers of CSPG4. (A) Graphic illustration of CSPG4‐CAR‐Ts cells against MPs expressing CSPG4. Created with Biorender.com. Diagrams quantifying the percentage of live cells of bone marrow‐derived MPs of both WT and mdx M0 (nonactivated), M1 (pro‐inflammatory) and M2 (anti‐inflammatory), or CFs after exposure to CSPG4.CARTs compared to cells co‐cultured with control CART (cCART). N = 3 biological replicates. (B) ELISA assay for CSPG4 in supernatants (SUP) isolated from WT and mdx MPs. The chart illustrates the optical density (OD) of CSPG4 in the two groups. Each dot represents the eluted fractions, N = 16. (C) FACSymphony of cardiac tissues. The first chart represents a scatter plot of t‐SNE relative to concatenated total cells from 3‐ or 10‐month‐old WT and mdx hearts. The second chart illustrates the distribution of CD45neg cells (light pink cluster) and myeloid cells (dark pink cluster) in all groups. (D) Graph of FACS analysis relative to number of total MPs (F4/80) positive for CSPG4 in 3‐ or 10‐month‐old WT and mdx hearts. (E) Expression of CSPG4 in subpopulations of MPs: CD80pos (M1), CD206 pos (M2), Ly6Clow (resident), and Ly6Chigh (monocytes) in 3‐ or 10‐month‐old WT and mdx hearts. Error bars show SEM. *p < 0.05, **p < 0.01 calculated using Student's t‐test and one‐way ANOVA.
