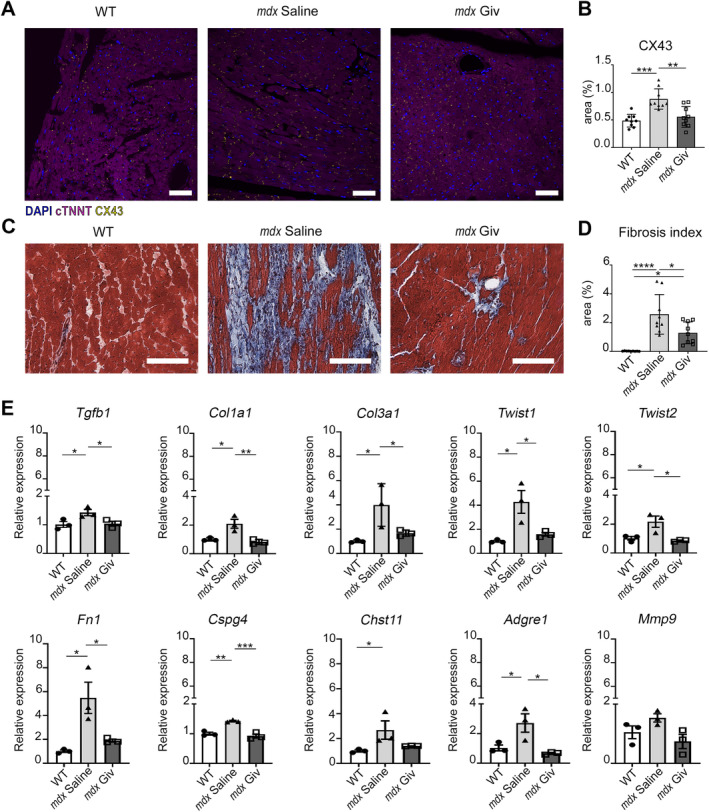
Figure 5.

Histological analysis and gene profile of cardiac tissue after treatment with givinostat in old mdx and WT mice. (A) Confocal images of immunostaining for gap junctions (CX43) and cardiomyocytes positive for cardiac troponin (cTNNT), N = 3 sections per N = 3 biological replicates. Scale bars, 50 μm. (B) Charts indicate area as percentage of CX43 (positive area/whole area). (C and D) Representative Masson's trichrome images of WT, mdx saline, and mdx Giv hearts and fibrosis index quantification (fibrotic area/whole area) after 60 days of treatment. Scale bars, 100 μm. N = 3 biological replicates. (E) qPCR of fibrosis‐related genes (Tgfb1, Col1a1, Col3a1, Twist1, Twist2, Fn1), cell surface proteoglycan (Cspg4); the enzyme catalyzes the transfer of sulfate groups on CSPG4 chains (Chst11) and inflammatory markers (Adgre1 and Mmp9). N = 3 biological replicates. Error bars show SEM. *p < 0.05, **p < 0.01, ***p < 0.001, ****p < 0.0001 were calculated using one‐way ANOVA and Student's t‐test.
