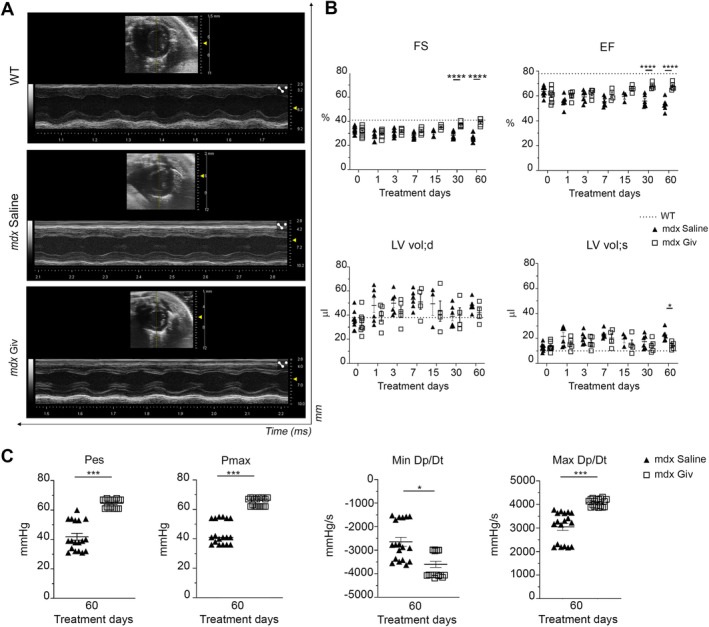
Figure 6.

Impact of givinostat on dystrophic cardiomyopathy. (A) Echocardiographic M‐mode images of parasternal long axis view of anterior and posterior walls of left ventricle of WT, mdx saline, and mdx Giv (Vevo 3100, VisualSonics). (B) Echocardiographic parameters: fractional shortening (FS), ejection fraction (EF), and left ventricular end‐diastolic/systolic volume (LV vol;d LV vol;s) in 10‐month‐old mice. The x‐axis shows givinostat or saline treatment on different days (0, 1, 3, 7, 30, and 60). A range of a minimum of three to a maximum of six biological replicates. (C) Hemodynamic analysis including end‐systolic pressure (P es), maximum pressure (P max), minimum rate of pressure change (Min Dp/Dt), and maximum (Max Dp/Dt). N = 3 biological replicates, N = 6 measurements/mouse. Error bars show SEM. *p < 0.05, **p < 0.01, ***p < 0.001, ****p < 0.0001 were calculated using two‐way ANOVA.
