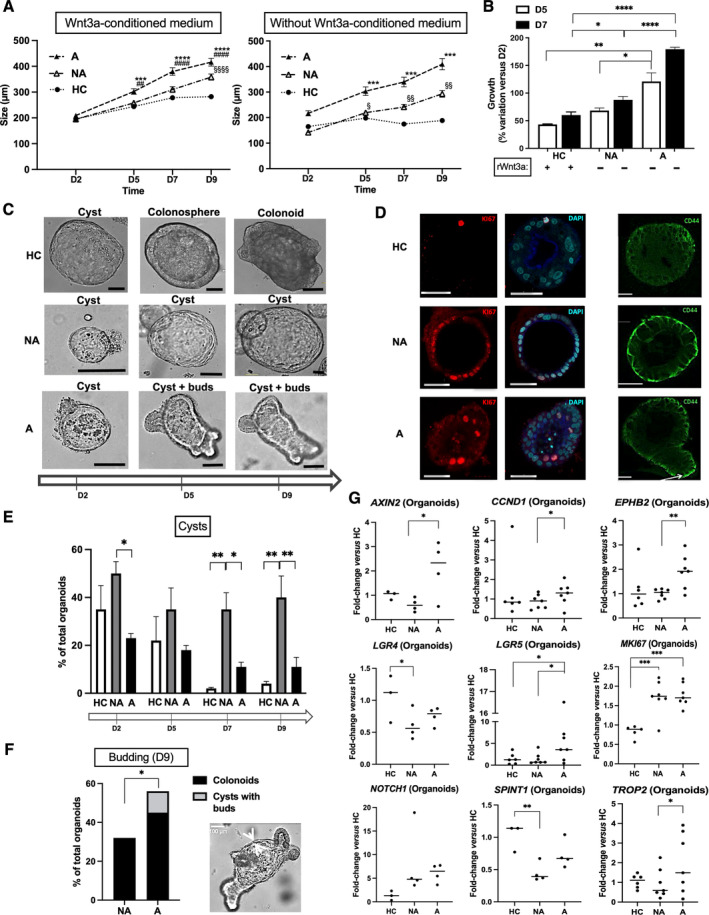
Figure 1.

Characterization of FAP organoids. (A and B) In contrast to organoids from healthy controls (HCs), FAP‐organoid growth (NA, nonadenomatous; A, adenomatous) was independent of WNT3a‐conditioned medium or recombinant WNT3a. (A) n patients: HC = 6, NA/A = 7 (with WNT3a‐conditioned medium), NA/A = 4 (without WNT3a‐conditioned medium), organoid size mean ± SEM (diameter, around 200–300 organoids per condition), ANOVA comparison of A to HC: ***p < 0.001 ****p < 0.0001, A to NA ## p < 0.01 #### p < 0.0001, NA to HC § p < 0.05 §§ p < 0.01 §§§§ p < 0.0001. (B) n patients: HC = 3, NA/A = 3, percentage variation of organoid size from D2 mean ± SEM (diameter at D2, mean ± SEM: HC 144 ± 18 μm, NA 117 ± 16 μm, A 76 ± 17 μm; around 10 organoids per condition), ANOVA comparison: *p < 0.05 **p < 0.01 ****p < 0.0001. (C) From D2 to D9 of culture, HC organoids develop as immature forms with a thin monolayer boarding a central lumen (cysts) to mature forms as colonospheres with a larger and polarized monolayer and then as colonoids with buds of neo‐crypts in formation. NA organoids show a delayed maturation with very large cysts. A organoid culture contains unique structures as cysts with buds. Scale bar, 100 μm. (D) Expression of proliferation marker Ki67 (immunolabeling) is increased in FAP organoids compared to HC. Labeling of nuclei by DAPI is shown. CD44 labeling is high in NA organoids and present in buds of A organoids. Representative of two independent experiments. Scale bar, 50 μm. (E) n patients: HC = 3, NA/A = 3, percentage cysts of total organoids mean ± SEM, ANOVA comparison: *p < 0.05 **p < 0.01. (F) n patients: NA/A = 3, percentage budding structures of total organoids mean ± SEM, paired (NA to A) t‐test comparison: *p < 0.05. A typical cyst with buds, structure unique to A organoid culture, is shown. (G) At D7 of culture, mRNA from A organoids compared to HC and/or NA organoids is enriched in markers of CBC stem cells (EPHB2, LGR5), β‐catenin transcriptional targets (AXIN2, CCND1), marker of cell proliferation (MKI67), and β‐catenin interacting partners (NOTCH1, TROP2). Compared to HC, NA organoids are characterized by both an increase of MKI67 and a decrease of LGR4 and SPINT1 mRNA, two guardians of the crypt integrity. n patients: HC = 3–6, NA/A = 4–7, ANOVA comparison between HC and NA/A: *p < 0.05 **p < 0.01 ***p < 0.001, paired t‐test comparison between NA and A: *p < 0.05 **p < 0.01.
