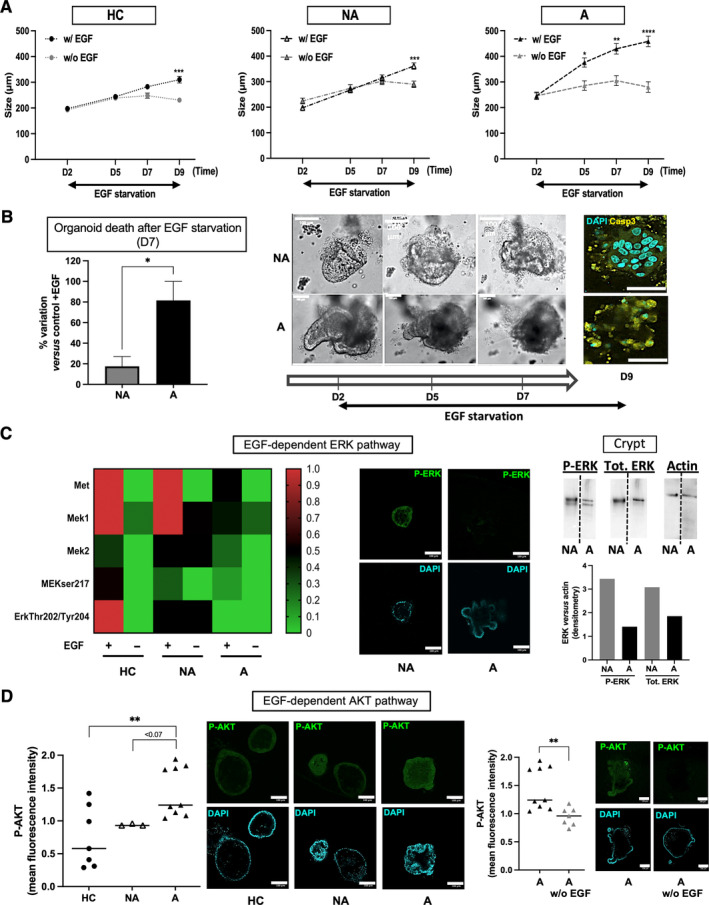
Figure 3.

EGF dependence of FAP organoids. (A) Compared to healthy controls (HCs) and NA organoids, A organoid growth is greatly more dependent on the presence of EGF in the culture medium. EGF was starved from D2 of the organoid culture since it was required for organoid closure between D0 and D2. n patients: HC = 6 NA/A = 3, organoid size mean ± SEM (diameter, around 100–300 organoids per condition), ANOVA comparison of +EGF to −EGF: *p < 0.05, **p < 0.01, ***p < 0.001, ****p < 0.0001. (B) EGF starvation induces death in A organoids. The number of dead organoids (example is shown with brightfield image of black and dense structure in A culture) versus total number of organoids was calculated at D7 of culture, and variation of this percentage in EGF‐starved conditions is shown. n patients: NA/A = 2, percentage variation mean ± SEM (around 50 organoids per condition), NA to A t‐test comparison: *p < 0.05. Immunofluorescence (IF): labeling for active Caspase‐3 (yellow) and nuclei by DAPI at D9 of culture is shown. (C) EGF‐dependent ERK pathway is decreased in FAP organoids. Heatmap of protein expression in EGF signaling pathway (D7 of culture) is shown. n patients: HC = 3, NA/A = 2, normalization of expression to HC MEK1. IF: labeling for Pthr202/tyr204‐ERK1/2 (green) and nuclei by DAPI at D7 of culture is shown. WB: western blotting for Pthr202/tyr204‐ERK1/2 (P‐ERK), total ERK (Tot. ERK) and actin, and their quantification, in NA and A crypts are shown. (D) EGF‐dependent AKT pathway is increased in FAP organoids. IF: labeling for Pser473‐AKT (green) and nuclei with DAPI at D7 of culture is shown and quantified. n patients: HC = 2, NA/A = 2, NA/A to HC ANOVA comparison, and A‐EGF to A t‐test comparison: **p < 0.01. Scale bar, 100 μm.
