Figure 4.

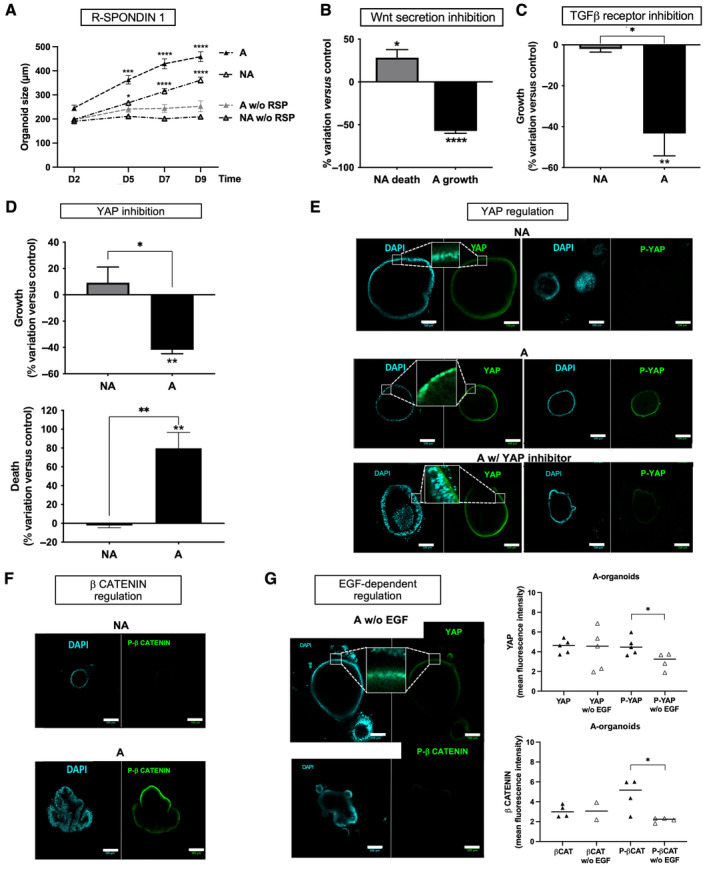
Signaling partners of EGF in FAP organoids. (A) R‐spondin 1 (RSP) starvation from D0 of the culture had a negative impact on FAP (NA, nonadenomatous; A, adenomatous) organoid growth. n patients: NA/A = 5, organoid size mean ± SEM (diameter, around 100–300 organoids per condition), ANOVA comparison of A with RSP to A without RSP and NA with RSP to NA without RSP: *p < 0.05 ***p < 0.001 ****p < 0.0001. (B) Wnt secretion inhibition using IWP12 (5 μm) impaired survival of NA organoids and growth of A organoids. n patients: NA/A = 3, percentage variation of organoid death and size between D2 and D7 of culture compared to control (0.02% DMSO), mean ± SEM calculated through analysis of around 10 organoids per condition, t‐test comparison with IWP12 to without IWP12: *p < 0.05, ****p < 0.0001. (C) TGF‐β receptor is implicated in growth of FAP adenoma. Addition of the TGF‐β receptor I inhibitor LY2157299 (LY, 0.5 μm) along the culture of FAP organoids induced a decrease of A organoid growth. n patients: NA/A = 3, percentage variation of organoid size between D2 and D7 of culture compared to control (without treatment), mean ± SEM calculated through analysis of around 10 organoids per condition, t‐test comparison with LY to without LY: **p < 0.01 A to NA *p < 0.05. (D) YAP controls growth and survival of adenoma. Addition of YAP inhibitor Verteporfin (VP, 0.5 μm) to FAP organoid culture inhibited growth/survival of A organoids. n patients: NA/A = 2 (growth) NA/A = 3 (survival), percentage variation of organoid size/death between D2 and D7 of culture compared to control (0.02% DMSO), mean ± SEM calculated through analysis of around 10 organoids per condition, t‐test comparison with VP to without VP: **p < 0.01 A to NA *p < 0.05 **p < 0.01. (E) YAP was activated (nuclear localization and Ptyr357 phosphorylation) specifically in FAP A organoids. Immunofluorescence (IF): labeling for YAP or P‐YAP (green) and nuclei using DAPI at D7 of culture is shown as well as Verteporfin's (YAP inhibitor) negative impact on it. n patients: NA/A = 2, images representative of five structures per condition and zoomed to show nuclear localization of YAP. (F) An activated form of β‐catenin (Pser552‐β‐catenin, P‐β CATENIN) is specifically found in A organoids. IF: labeling of Pser552‐β‐catenin (green) and nuclei by DAPI at D7 of culture is shown. Representative images from NA/A = 2 patients. (G) Activated forms of YAP (nuclear localization and Tyr357‐phosphorylation) and β‐catenin (Pser552‐β CATENIN) are dependent on EGF. IF quantification of total (YAP, βCAT) and phosphorylated forms (P‐YAP, P‐βCAT) of YAP and β‐catenin in FAP A organoids are shown, as well as representative images of the impact of EGF starvation on that labeling. IF: labeling of YAP/Pser552‐β‐catenin (green) and nuclei by DAPI at D7 of culture is shown. n patients: A = 2, t‐test comparison: *p < 0.05. Scale bar, 100 μm.
