Figure 5.

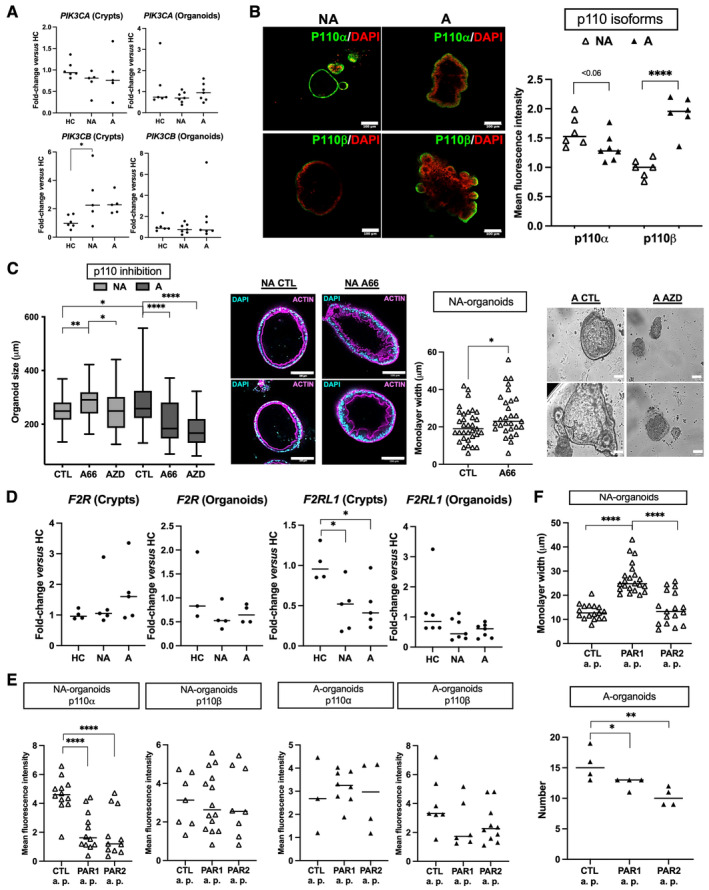
p110 isoforms of PI3K as pharmacological targets in FAP. (A) p110 isoforms (α, PIK3CA; β, PIK3CB) of PI3K were studied through their mRNA expression in crypts and organoids (D7 of culture). Only PIK3CB was increased in FAP (NA, nonadenomatous; A, adenomatous) crypts compared to healthy controls (HCs). n patients: HC = 6, NA/A = 5 (crypts) or 7 (organoids). (B) Immunolabeling for p110 isoforms in FAP organoids. Immunofluorescence (IF): quantification and representative images of labeling are presented. IF: labeling of p110α and p110β (green) and nuclei using DAPI at D7 of culture is shown. n patients: NA/A = 2, ANOVA comparison: ****p < 0.0001. (C) Pharmacological inhibition of p110α (A66, 0.5 μm) and p110β (AZD6482, 0.5 μm) induces NA organoid maturation and A organoid death, respectively. Growth (n patients: NA/A = 3, diameter size of around 40 organoids analyzed per condition) and epithelial monolayer width (n patients: NA = 4) quantifications are shown, as well as representative images at D7 of culture (n patients: NA/A = 3) of actin labeling and organoid death (brightfield images). IF: labeling of actin (magenta) and nuclei using DAPI is shown. Organoid size: ANOVA comparison versus control (CTL, 0.005% DMSO) or between NA with A66 and NA with AZD: *p < 0.05, **p < 0.01, ****p < 0.0001. Epithelial monolayer width: t‐test comparison, *p < 0.05. (D) Protease‐activated receptors (PAR1, F2R; PAR2, F2RL1) were studied through their mRNA expression in crypts and organoids (D7 of culture). Only F2RL1 was decreased in FAP (NA and A) crypts compared to HCs. n patients: HC = 4 (crypts) and 3–6 (organoids), NA/A = 5 (crypts) and 4–7 (organoids). (E) PAR1 and PAR2 agonist peptides (PAR1 a.p. and PAR2 a.p., respectively TFLLR‐NH2 and SLIGRL‐NH2, 100 μm) or control peptides (Ctl a.p., mixture of reversed sequences, 100 μm) were added daily from D2 to D5 of organoid culture and IF of p110 isoforms (α, β) and its quantification were performed. n patients: NA = 3, A = 2. ANOVA comparison: ****p < 0.0001. (F) PAR1 and PAR2 activation was performed as in E. The measurements of the epithelial monolayer width in NA organoids and of the number of A organoids are shown. n patients: NA = 3, A = 4, ANOVA comparison: *p < 0.05 **p < 0.01 ****p < 0.0001. Scale bar, 100 μm.
