. 2024 Dec 3. Online ahead of print. doi: 10.1039/d4cb00256c

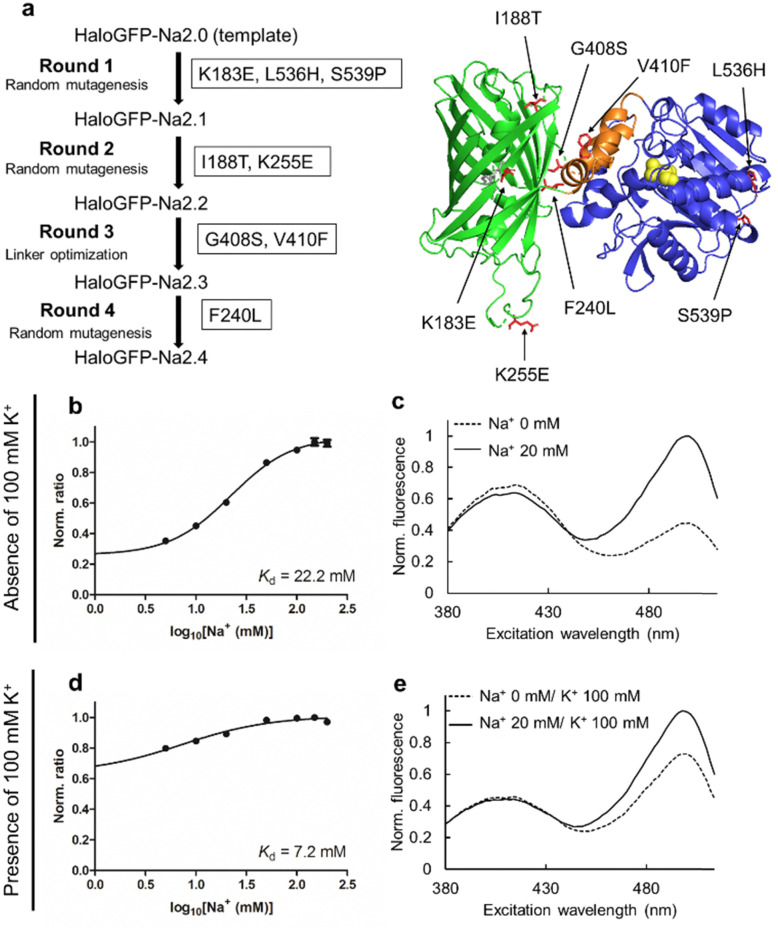
Fig. 2. (a) Summary of mutations acquired during four rounds of directed evolution. The structure is predicted by AlphaFold2.31 (b) and (c) Excitation ratio as a function of Na+ concentration (b) and fluorescence excitation spectra (555 nm emission wavelength) of HaloGFP-Na2.4 + ACE-HTL1 ± 20 mM Na+, in the absence of 100 mM KCl (c). The spectra for (b) were measured with the ligand (n = 1) in the absence of 100 mM KCl in 30 mM Tris–HCl (pH 7.2) at the indicated Na+ concentrations at 400 nm and 500 nm excitation wavelength and 555 nm emission wavelength. The error bar shows ± S.D. (N = 3). (d) and (e) Excitation ratio as a function of Na+ concentration (d) and fluorescence excitation spectra of HaloGFP-Na2.4 + ACE-HTL1 ± 20 mM Na+, in the presence of 100 mM KCl (e). Other than the presence of KCl, all other conditions were identical to those described above. The error bar shows ± S.D. (N = 3).

Fig. 2