. 2024 Dec 3. Online ahead of print. doi: 10.1039/d4cb00256c

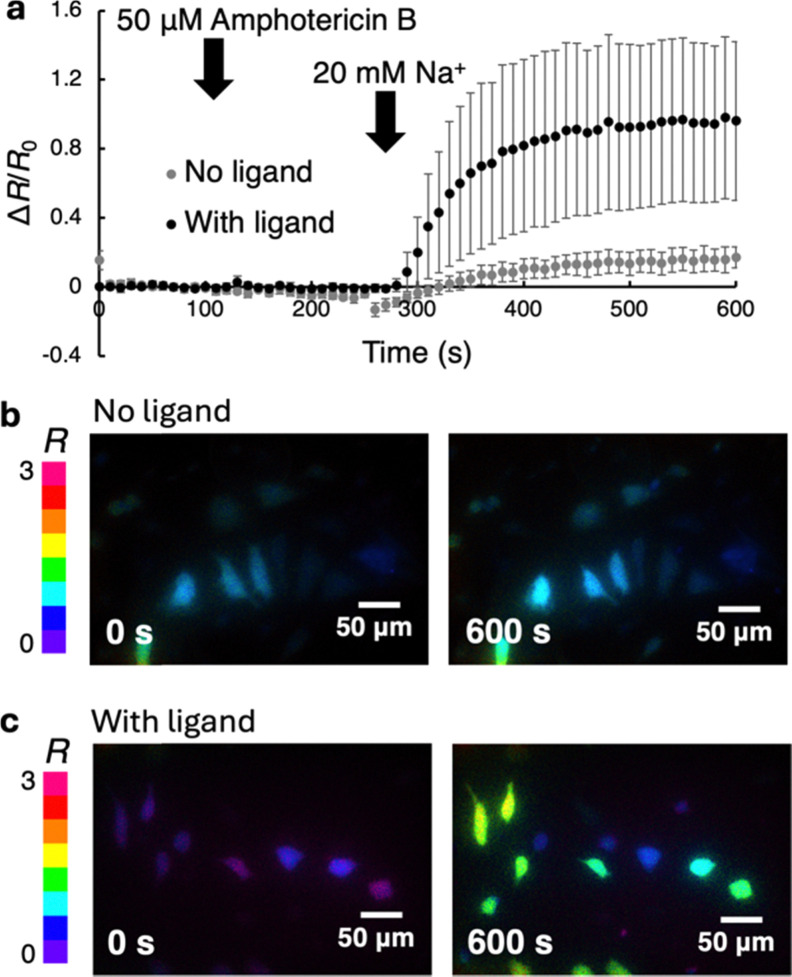
Fig. 3. (a) Ratiometric responses to Na+ treatment for permeabilized HeLa cells expressing HaloGFP-Na2.4 and incubated with or without the ACE-HTL1 ligand. The error bar shows ± S.D. (N = 11 with ligand, N = 10 without ligand). (b) and (c) Ratiometric images of permeabilized HeLa cells used to acquire the data shown in (a). Shown in (b) are cells that are expressing HaloGFP-Na2.4, but have not been treated with ACE-HTL1, before (left image) and after (right image) Na+ addition. Shown in (c) are cells that are expressing HaloGFP-Na2.4 and have been treated with ACE-HTL1, and have been otherwise treated identically to the cells in (b). The color bar shows the color representations for ratios ranging from 0 to 3.

Fig. 3