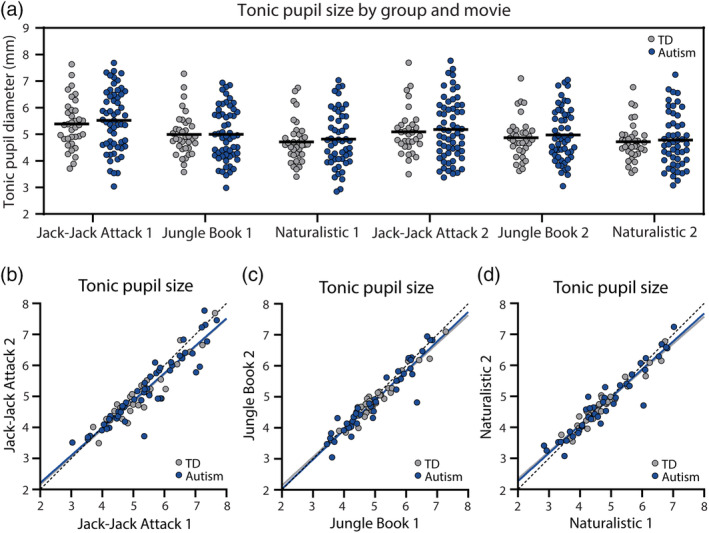
FIGURE 1.

Tonic pupil diameter (mm) in each of the six movies. (a) Scatter plot demonstrating tonic pupil diameter for each individual, across both groups, per movie. Black line: mean tonic pupil diameter per group. There were no significant differences across groups. (b–d) Scatter plots demonstrating stability of tonic pupil diameter per participant across two presentations of each movie. Each point represents a single child. Solid lines: Least squares fit. Dotted line: unity line. Blue: autism, Gray: TD.
