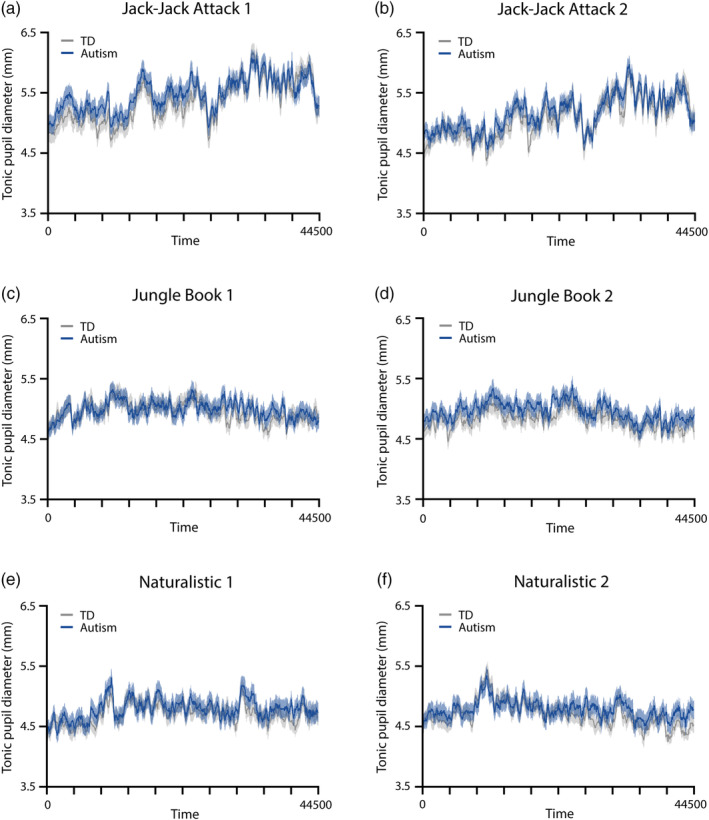
FIGURE 2.

Time‐courses of pupil diameter from each presentation of the three movies. (a, c, e) First presentation. (b, d, f) Second presentation. Solid line: average pupil diameter across participants per group. Shaded area: standard error of the mean. Blue: autism. Gray: TD.
