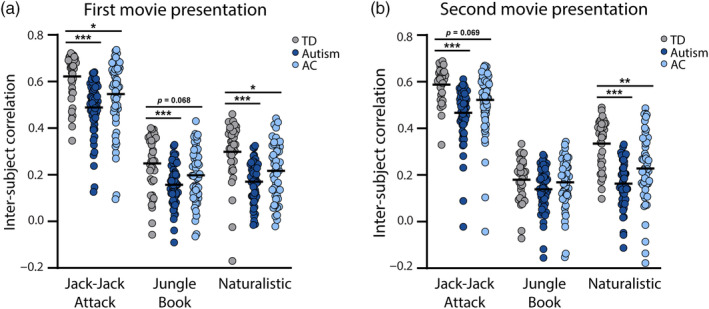
FIGURE 3.

Comparison of inter‐SC values across groups for each movie and presentation. (a) First presentation. (b) Second presentation. Gray: inter‐SC within the TD group. Dark blue: inter‐SC within the autism group. Light blue: inter‐SC of children with autism relative to TD controls (i.e., AC). Asterisks: Significant differences across groups according to ANCOVA tests (*p < 0.05, **p < 0.01, ***p < 0.001).
