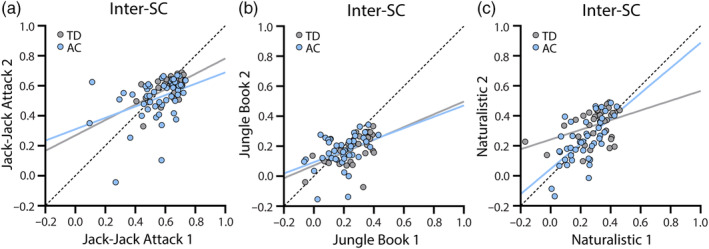
FIGURE 4.

Scatter plots of inter‐SC values demonstrating their correlation across the two presentations of Jack‐Jack Attack (a), Jungle Book (b), and Naturalistic (c) movies. Gray: inter‐SC within the TD group. Light Blue: inter‐SC of children with autism relative to controls (AC). Solid lines: Least squares fit. Dotted line: unity line. Inter‐SC, inter‐subject correlation.
