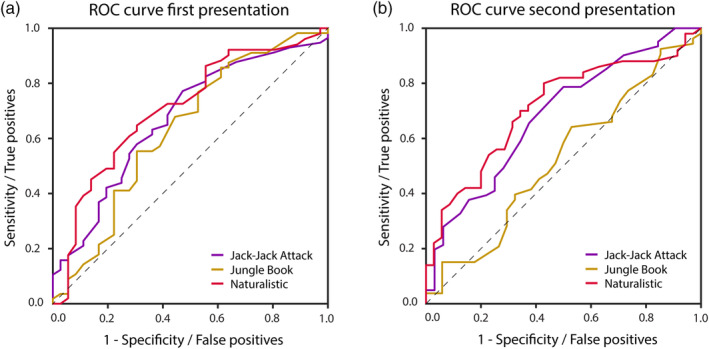
FIGURE 5.

ROC analyses using inter‐SC to classify autistic and TD participants. (a) First presentation. (b) Second presentation. Purple: Jack‐Jack Attack, Yellow: Jungle Book, Red: Naturalistic movie. Black dashed line: unity line. Inter‐SC, inter‐subject correlation; ROC, receiver operating characteristic.
