
Figure 11.
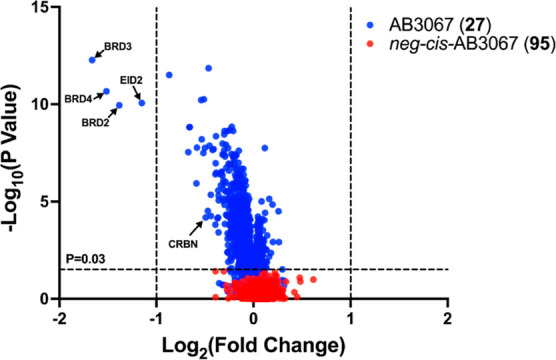
Proteomics of AB3067 (27) and neg-cis-AB3067 (95) treated HEK293 cells. Volcano plot showing impact on the proteome of HEK293 cells after 4 h following a 250 nM treatment of either 27 (blue) or 95 (red) relative to a vehicle control (DMSO). The data plotted is log2 of the normalized fold change in abundance against -log10 of the P value per protein identified from TMT (tandem mass tagging) mass spectrometry analysis produced from five independent repeats. A total of 7276 proteins were identified in this experiment. Dashed lines on the x-axis indicates boundary line for proteins to be considered differentially expressed at [Log22 = 1]. Dashed line on the y-axis indicates boundary line for proteins to be considered statistically significant; any proteins with a -log10(P value) ≥ 1.5 to have a P value ≤ 0.03.