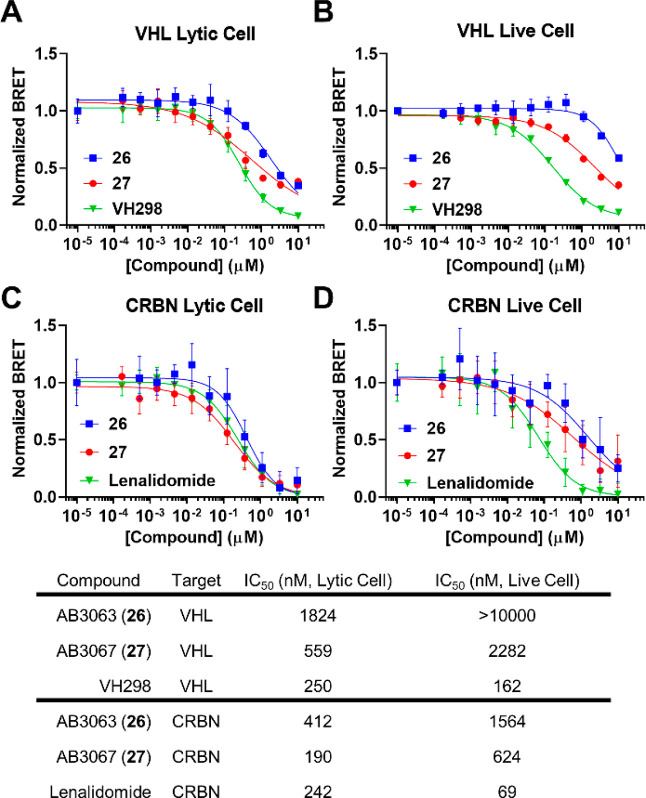
Figure 7.
NanoBRET lytic and live cell target engagement assay of 26 and 27. (A) & (B) Competitive displacement profiles of HEK293 cells transiently transfected with NanoLuc-VHL, which are incubated with a VHL fluorescent tracer in the presence of serial dilutions of 26, 27 or VH298 in cells lysed with digitonin (A) or in live cells for 2 h (B). (C) & (D) Competitive displacement profiles of HEK293 cells transiently transfected with NanoLuc-CRBN which are incubated with a CRBN fluorescent tracer in the presence of serial dilutions of 26, 27 or lenalidomide in cells lysed with digitonin (C) or in live cells for 2 h (D). Data are represented as NanoBRET ratios normalized to 0 μM compound. Error bars are expressed as S.D. of the mean of n = 2 biological replicates (each consisting of 3 technical replicates) (A) & (B) or n = 3 biological replicates (each consisting of 3 technical replicates) (C) & (D). IC50 values are tabulated below for indicated target, compound, and assay format.

