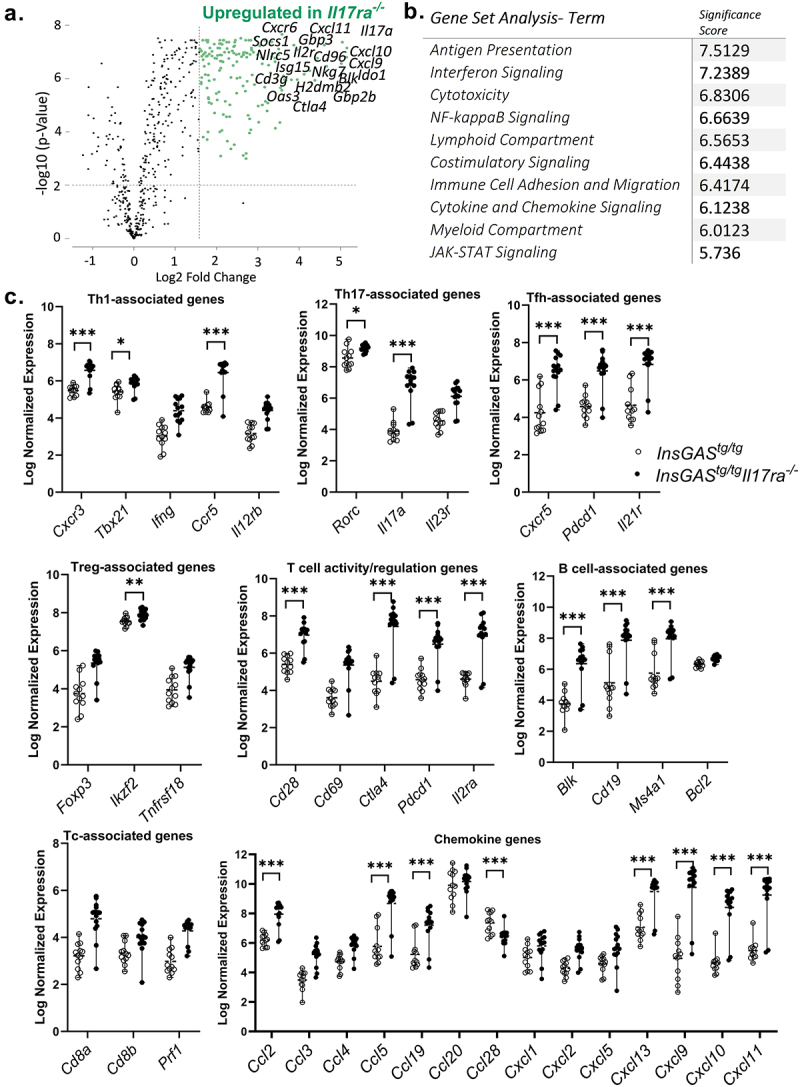
Figure 4.

PanCancer IO 360 gene expression analysis panel data supports changes in antigen presentation pathways and lymphocyte activation. A. Volcano plot of differentially expressed genes in stomach tissue from InsGAStg/tg compared to InsGAStg/tgIl17ra-/- tissue (at 3 mpi, 5 mo of age). Differential gene expression was determined by analyzing data generated using the Nanostring PanCancer IO360 nCounter panel using n = 12-14 samples per genotype. B. Gene set annotation analysis indicates that a significant number of genes associated with antigen presentation, interferon signaling, cytotoxicity, NFkB signaling are upregulated. C. Graphical representations of normalized expression values from Nanostring data set for lymphocyte subsets (Th1, Th2, Th17, Treg, Tfh, B cells) and chemokines. Statistical differences were determined using differential gene expression analysis and * p-adj <0.05, ** p-adj <0.001 and *** p-adj <0.0001. Supplemental table 3 also contains differential gene expression data.
