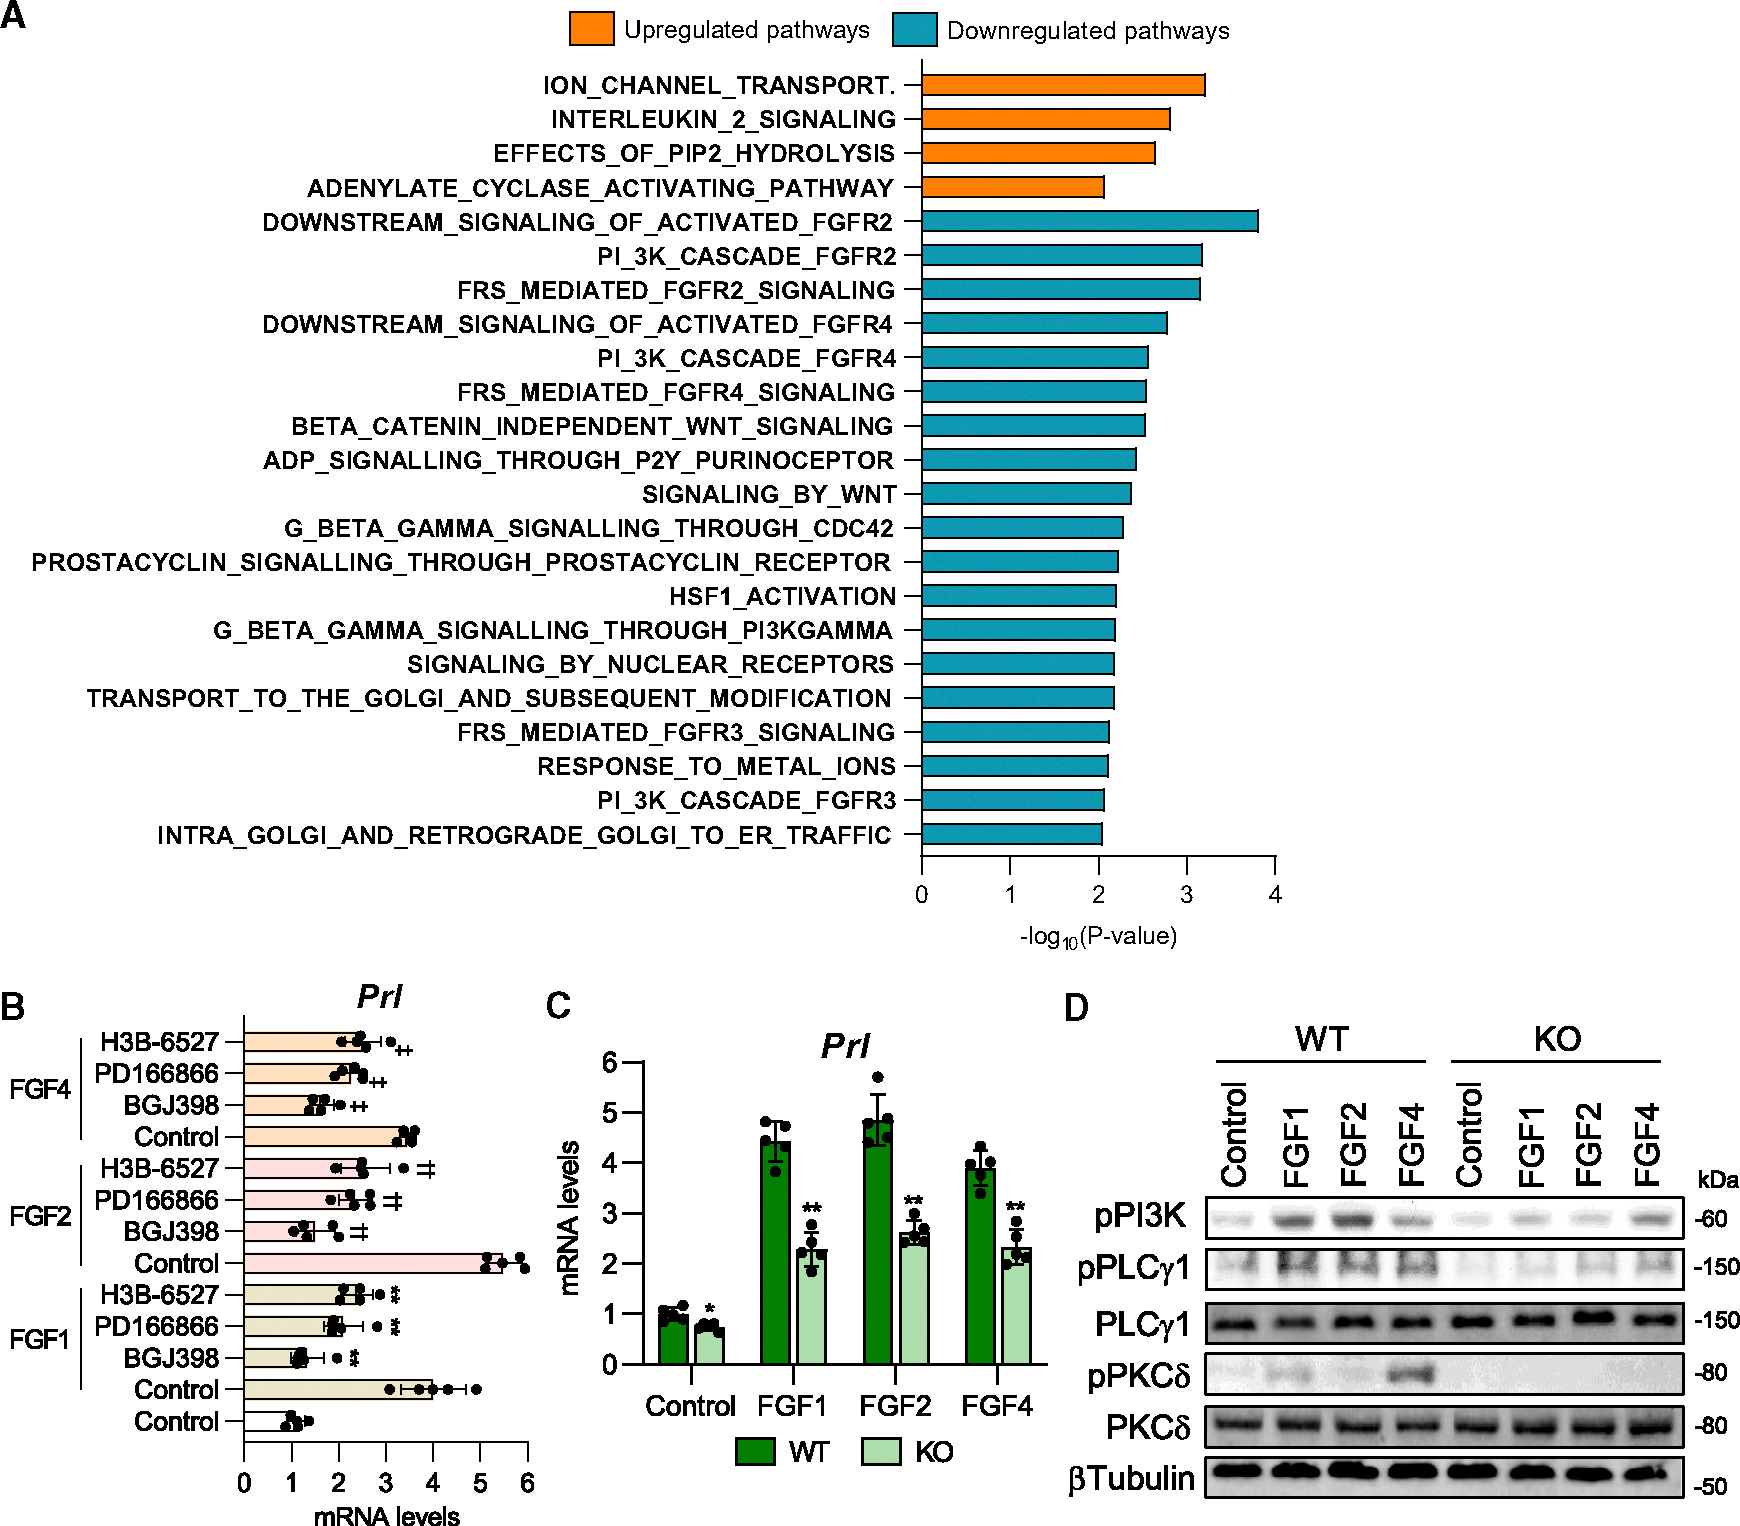
Figure 5. Placental Sod3 KO inhibits the FGF-prolactin axis in the pituitary gland.

(A) Reactome pathway analysis of placental Sod3f/f and Sod3−/− dams.
(B) Prl mRNA expression levels of 100 ng/mL recombinant fibroblast growth factor (FGF)1-, FGF2-, or FGF4-stimulated mouse primary pituitary cells with or without 10 μM FGF receptor (FGFR) inhibitors. BGJ398: FGFR1/2/3 inhibitor, PD16686: FGFR1 inhibitor, H3B-6527: FGFR4 inhibitor.
N = 5; three technical replicates for each group; **p < 0.01 vs. FGF1-control, ††p < 0.01 vs. FGF2-control, and ‡‡p < 0.01 vs. FGF4-control.
(C) Prl mRNA expression levels in recombinant FGF1-, FGF2-, or FGF4-stimulated primary pituitary cells from placental Sod3f/f and Sod3−/− dams on day 10 after delivery.
(D) Phosphorylation levels of FGFR-induced signaling molecules in recombinant FGF1-, FGF2-, or FGF4-stimulated primary pituitary cells from placental Sod3f/f and Sod3−/− dams.
N = 3 in each group; three biological and technical replicates for each group.
