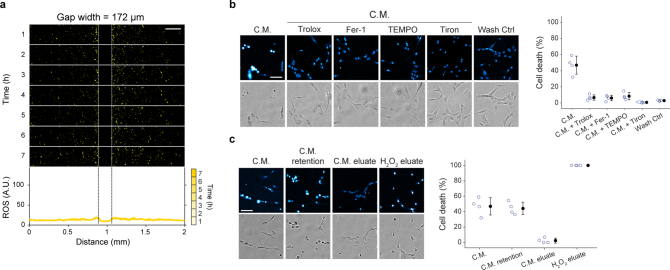
Extended Data Fig. 5. The spatial coupling mechanism involves the diffusion of a type of ROS.
a, Time-lapse image sequence of ROS (yellow) in erastin-treated cells across a gap (width = 172 μm). Lower panel: the mean intensity of ROS was calculated along the 2-mm distance at specific time-points. b, Left panel: Nuclear fluorescence and bright field images 20 h after incubation with erastin-free conditioned media (C.M.), ROS scavenger-treated C.M. (Fer-1, 60 nM; Trolox, 20 µM; TEMPO, 125 µM; Tiron, 2 mM), and media after washing out erastin-containing media in a culture dish without cells (Wash Ctrl). c, Nuclear fluorescence and bright field images 12 h after incubation with C.M., the eluate and retention fractions of the centrifugally filtered C.M., and eluate of the centrifugally filtered H2O2-containing media. Right panels in (b, c): Cell death (%) quantified from left panel. Data represent mean ± s.d. of four wells. All experiments were independently repeated three times with similar results. Scale bars, 200 (a), and 100 (b, c) μm.

