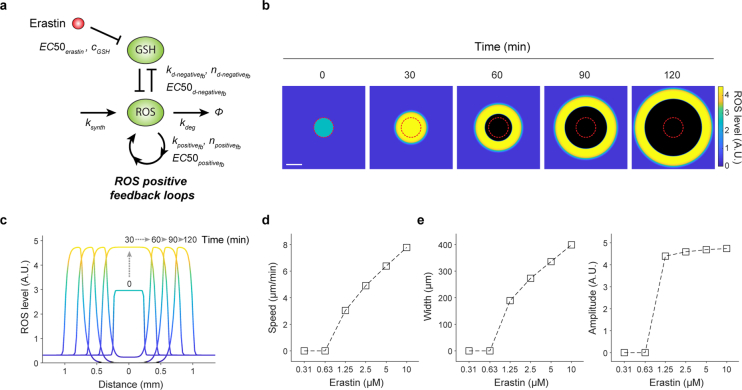
Extended Data Fig. 10. In silico simulations of ROS trigger waves.
a, A diagram of the ROS feedback loops and parameters used to build the mathematical model. b, c, Time-course simulations of ROS levels in a 200 × 200 population of cells treated with 10 µM erastin. Photoinduction was simulated by elevating ROS levels above the unstable steady state (USS) within the area of the red circle. Scale bar, 400 μm (b). c, Cross-section of ROS kinetics along the midline in (b). d, Speed of ROS propagation as a function of erastin concentration. e, Width (left panel) and amplitude (right panel) of the ROS wave front as a function of erastin concentration.

