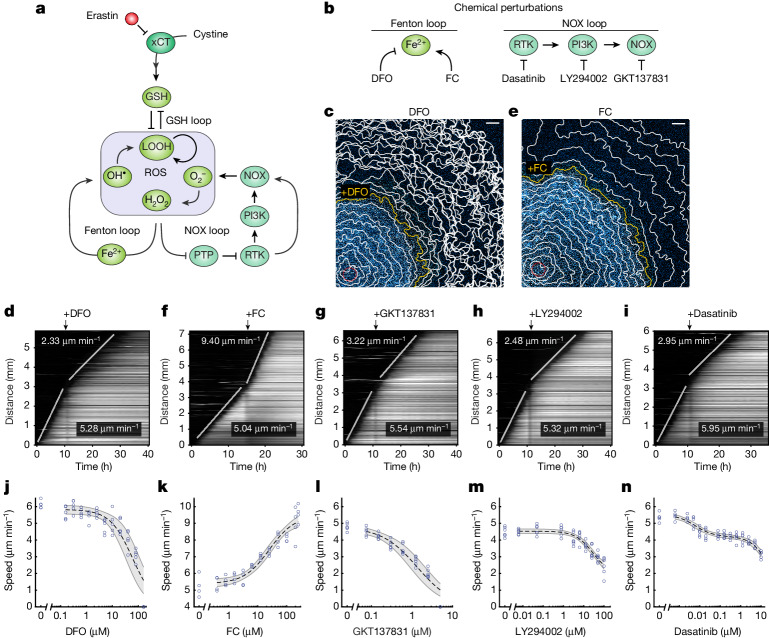
Fig. 3. ROS feedback loops modulate the speed of ferroptotic trigger waves.
a, A ferroptosis network includes three ROS feedback loops. b, Chemical perturbations applied to modulate the strength of Fenton and NOX feedback loops in erastin-treated cells. c,d, The speed of ferroptotic trigger waves declines after iron chelation. c, Nuclear dye fluorescence image (11 h after photoinduction) overlaid with cell death contours. The yellow contour indicates the timepoint at which DFO (80 µM) was added. d, Kymograph for the experiment in c. e,f, The speed of ferroptotic trigger waves increases after iron addition. e, Nuclear dye fluorescence image (15 h after photoinduction) overlaid with cell death contours. The yellow contour indicates the timepoint at which FC (250 µM) was added. f, Kymograph for the experiment in e. g–i, Addition of GKT137831 (1.25 µM) (g), LY294002 (100 µM) (h) or dasatinib (0.6 µM) (i) slows down ferroptotic trigger waves. j–n, Wave speed as a function of DFO (j), FC (k), GKT137831 (l), dasatinib (m) and LY294002 (n) concentrations. The dose–response curves (dashed line) were obtained by fitting the data to a Michaelian inhibition function for DFO, LY294002 and GKT137831; to a Michaelian activation function for FC; and to a biphasic inhibition function49 for dasatinib (Methods). The shaded area bounded by grey lines represents the 95% confidence interval of model prediction. Data are derived from five (DFO, 0–0.6 µM and 2.5–160 µM), four (DFO, 1.25 µM), four (FC) and six (GKT137831, LY294002, dasatinib) technical replicates. Fitted parameters are shown in Extended Data Table 1. For c–n, data are representative of three biological repeats. Scale bars, 500 μm (c and e).

