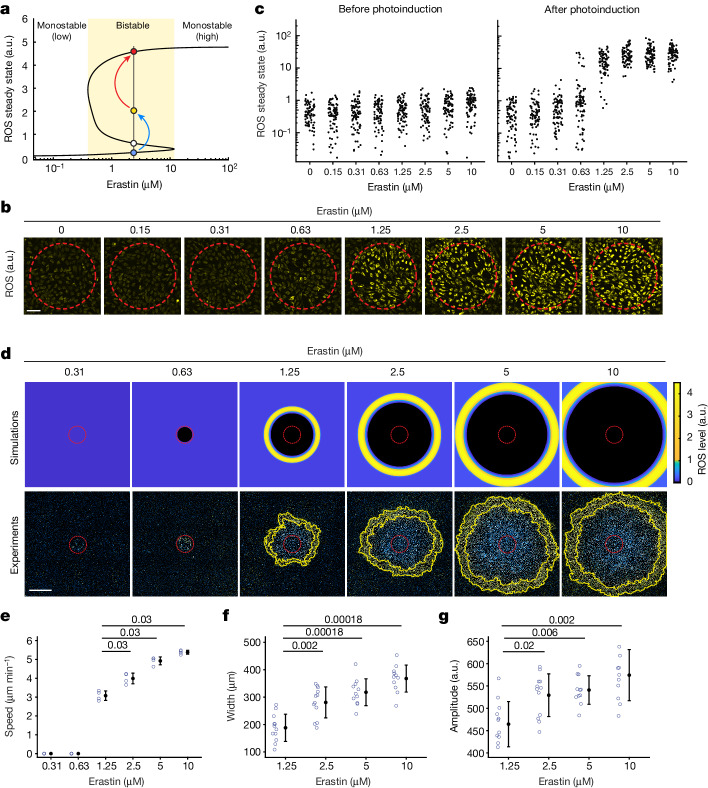
Fig. 4. Ferroptosis stress primes cells for ROS bistability and promotes the propagation of ferroptotic trigger waves.
a, In silico simulations showing ROS steady state as a function of erastin concentration. ROS steady state bifurcates from a monostable (low) to a bistable regime (yellow area) with increased erastin concentration. Stable low and high ROS steady states and the USS are denoted by blue, red and white circles, respectively. ROS elevation by photoinduction (blue arrow, elevation from blue to yellow circle) allows cells to surpass the USS, above which ROS is amplified (red arrow) to the high steady state. b, Images of ROS fluorescence (yellow) 20 min after photoinduction at different erastin concentrations. c, Single-cell ROS steady states were measured before and after photoinduction at different erastin concentrations in b. For each erastin level, 80 cells are shown. d, Increasing erastin concentrations promote ROS wavefront propagation. Simulations (top) and experiments (bottom) of ROS propagation in cell populations treated with different erastin concentrations 6 h after photoinduction. e–g, Wave speed (e), wavefront width (f) and amplitude (g) at different erastin concentrations. Data are mean ± s.d. For wave speed, four technical replicates; wavefront width and amplitude were measured from twelve directions. Statistical analysis was performed using two-sided Wilcoxon rank-sum tests with false-discovery rate adjustment; P values are shown at the top. For b–g, data are representative of three biological repeats. Scale bars, 100 μm (b) and 800 μm (d).

