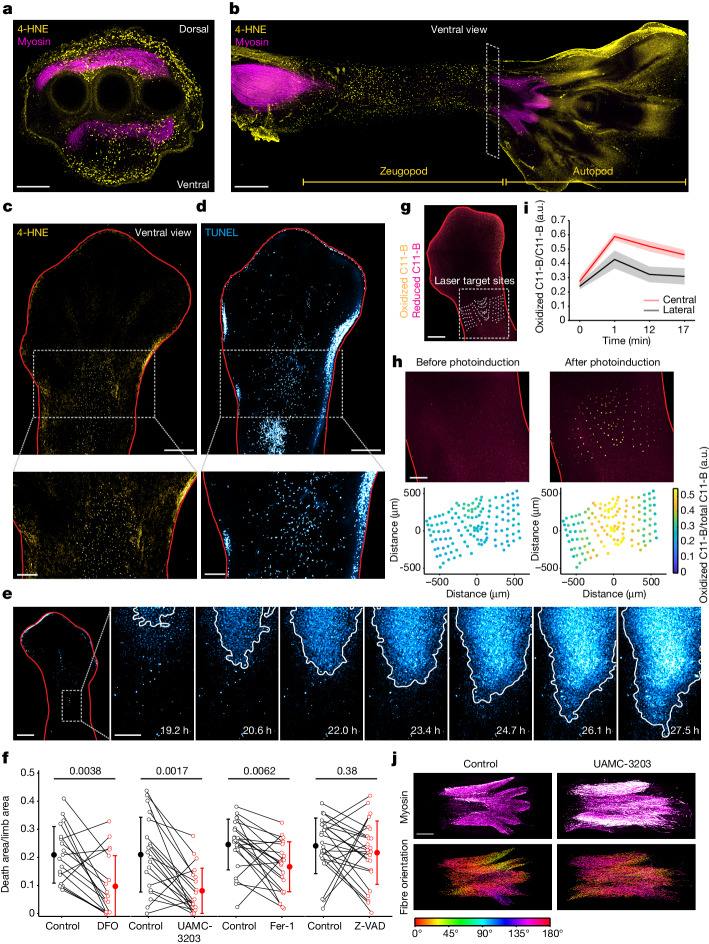
Fig. 5. Ferroptosis and its propagation facilitate muscle remodelling in the avian limb.
a,b, Co-immunostaining of lipid peroxidation marker (4-HNE, yellow) and myosin heavy chain (myosin, magenta) in transverse (a) and longitudinal (b) sections (HH33 limbs). The transverse section (a) is located at the zeugopod (box in b). The longitudinal section (b) features the ectodermal layer. c,d, Whole-mount immunostaining of 4-HNE (c) and TUNEL staining (d) in HH32 limbs outlined in red (magnified views are shown at the bottom). e, Nuclear dye fluorescence image (HH31 limb) (left). Right, time-lapse images of cell death (magnified views of the box are shown on the left). f, Cell death area with or without DFO (10 mM, n = 18), UAMC-3203 (1 μM, n = 20), Fer-1 (10 μM, n = 22) and Z-VAD-FMK (200 μM, n = 24). Data are mean ± s.d. Statistical analysis was performed using two-sided Wilcoxon rank-sum tests; P values are shown at the top. g,h, PALP assay of C11-BODIPY581/591 (C11-B)-stained limbs (merged images of oxidized and reduced C11-BODIPY581/591). g, C11-BODIPY581/591-stained limb overlaid with the laser target sites. h, Magnified views of the box in g (top). Bottom, lipid peroxidation levels at target sites in the top images. i, Lipid peroxidation levels in the central (within 100 μm of the centre axis) and lateral (≥350 μm away from the centre axis) regions. Data are mean ± s.d. of 28 (central) and 61 (lateral) target sites. j, Immunostaining of myosin from UAMC-3203-treated and vehicle-control-treated embryos (HH33) (top). Bottom, muscle fibres colour coded according to their orientations. For a–e and g–j, data are representative of three biological repeats. Scale bars, 200 μm (a, c (bottom), d (bottom), h and e (right seven images)), 400 μm (b, c (top) and d (top)), 500 μm (g), 600 μm (e (left)) and 300 μm (j). Ventral views are shown unless otherwise stated.

