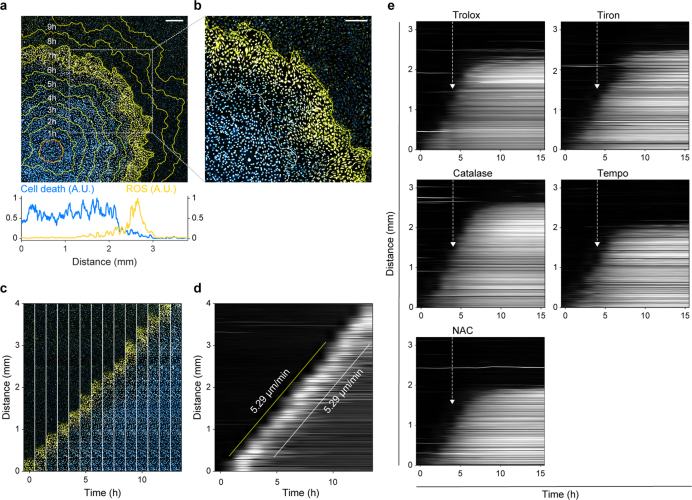
Extended Data Fig. 4. Cellular ROS (·OH, O2− and H2O2) wave fronts precede ferroptosis propagation.
a, b, Cellular ROS was monitored in erastin-treated cells using a general ROS dye (CellROX) that detects ·OH, O2− and H2O2. Images are derived from merging ROS (yellow) and nuclear dye fluorescence (cyan). Each yellow contour represents the border of the ROS wave front at a specific time-point. a, Upper panel: Image (8 h after photoinduction) overlaid with ROS contours 1-11 h after photoinduction. Lower panel: Fluorescence intensities of cell death and ROS signals were quantified across the bottom region of the image. b, Zoomed-in view of the box in (a). c, Time-lapse image array of ROS (yellow) and cell death (cyan) over 14 h. The image sequence was cropped from the same experiment in (a). d, Kymograph for ROS propagation in (a). The slopes of the yellow and white lines represent the speeds of ROS wave fronts and cell death propagation, respectively. The time-lapse movie for this experiment is shown in Supplementary Video 4. e, Kymographs of cell death propagation in erastin-treated cells after addition of ROS scavengers (Trolox, 6 µM; Tiron, 2 mM; catalase, 2000 U/mL; TEMPO, 125 µM; NAC, 15 µM) 4 h after photoinduction (white arrow). Data shown are representative of three biological repeats. Scale bars, 400 (a), and 250 (b) μm.

