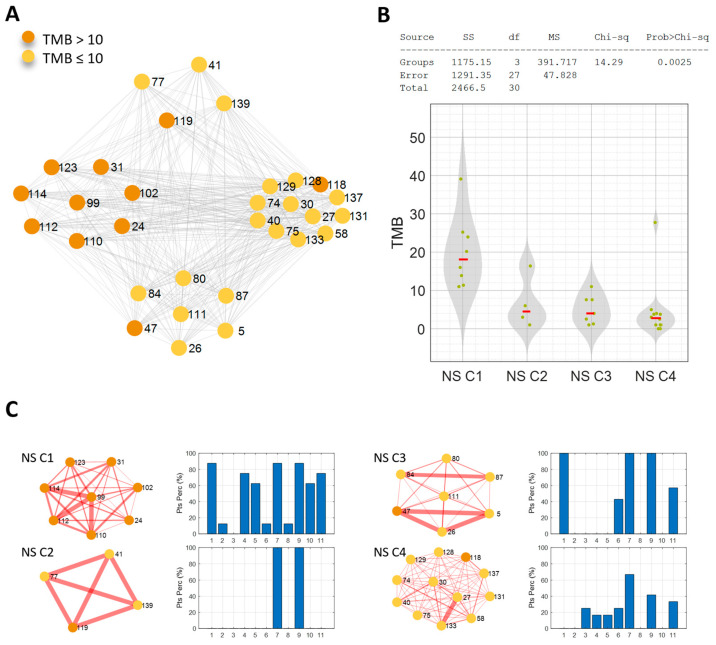
Figure 3.
(A) Patient similarity network of the never-smoking cohort. Nodes color codes for the TMB level: orange for TMB > 10 Mut/Mb, yellow for TMB ≤ 10 Mut/Mb. (B) Kruskal–Wallis test results on the effect of TMB. (C) The four identified communities are shown with the associated mutated pathways profile: bar diagrams of the percentage of patients characterized by at least one mutation in each of the analyzed pathways (1-Cell cycle-pathway, 2-Hippo pathway, 3-Myc pathway, 4-Notch pathway, 5-Oxidative stress/Nrf2 pathway, 6-PI3K pathway, 7-RTK/RAS/MAP pathway, 8-TGF beta pathway, 9-p53 pathway, 10-beta-catenin/Wnt pathway, and 11-DDR pathway).

