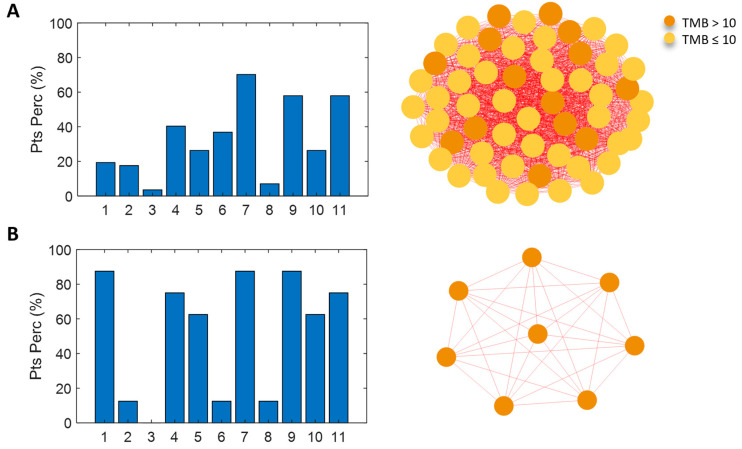
Figure 5.
Mutated pathways profile of the OAK/POPLAR NS community (panel A) correlated with the mutational profile of the real-world NS C1 (panel B): Spearman correlation, ρ = 0.727. The bar diagrams show the percentage of patients characterized by at least one mutation in each of the analyzed pathways (1—Cell cycle-pathway, 2—Hippo pathway, 3—Myc pathway, 4—Notch pathway, 5—Oxidative stress/Nrf2 pathway, 6—PI3K pathway, 7—RTK/RAS/MAP pathway, 8—TGF-β pathway, 9—p53 pathway, 10—β-catenin/Wnt pathway, and 11—DDR pathway). In the network community representation, nodes represent the patients and their color codes for the TMB level: orange for TMB > 10 Mut/Mb, yellow for TMB ≤ 10 Mut/Mb.

