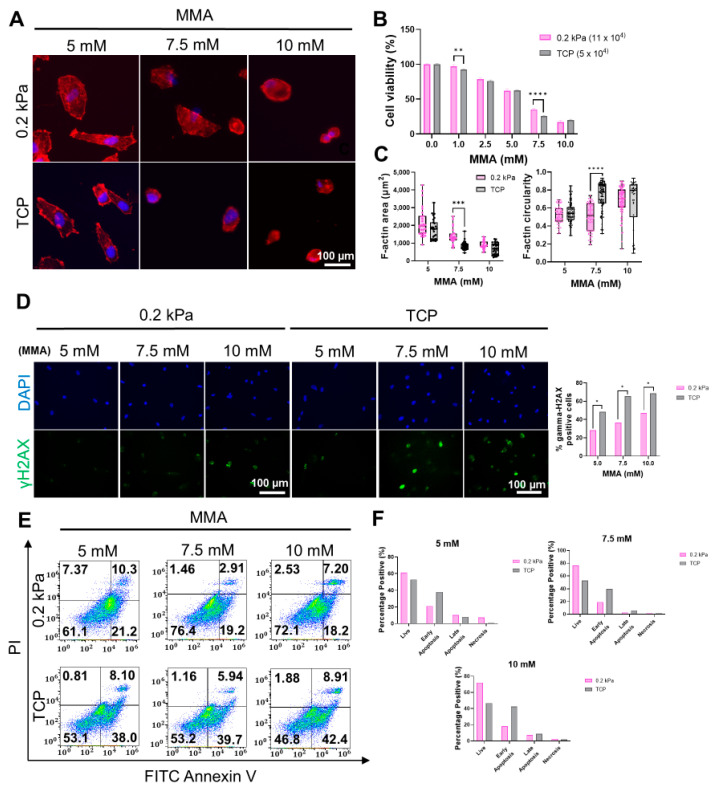
Figure 5.
Effects of MMA on HGFs cultured on 0.2 kPa and TCP. (A) Immunofluorescence images of DAPI (blue) and F-actin (red)-stained HGFs treated with 5 mM, 7.5 mM, and 10 mM MMA for 12 h, showing cell morphology differences between 0.2 kPa and TCP substrates. Scale bar = 100 µm. (B) Cell viability after MMA treatment, indicating a significant reduction in TCP compared to 0.2 kPa at higher MMA concentrations (n = 5). (C) Quantification of cell area and circularity, showing a smaller cell area and more spreading on 0.2 kPa (n = 90). (D) Immunofluorescence staining for γH2AX (green) and DAPI (blue) showing DNA damage; TCP cells exhibited higher γH2AX levels. Scale bar = 100 µm. (E) Flow cytometry analysis of apoptosis and necrosis following MMA treatment, with higher apoptotic/necrotic populations on TCP. (F) Quantification of apoptotic and necrotic cells, with apoptosis and necrosis increasing at higher MMA concentrations, particularly on TCP. Representative data sets after three independent experiments are shown. Statistical significance was determined by two-way ANOVA followed by Tukey’s multiple comparison test (ns = non-significant, * p < 0.05, ** p < 0.01, *** p < 0.001, **** p < 0.0001).

