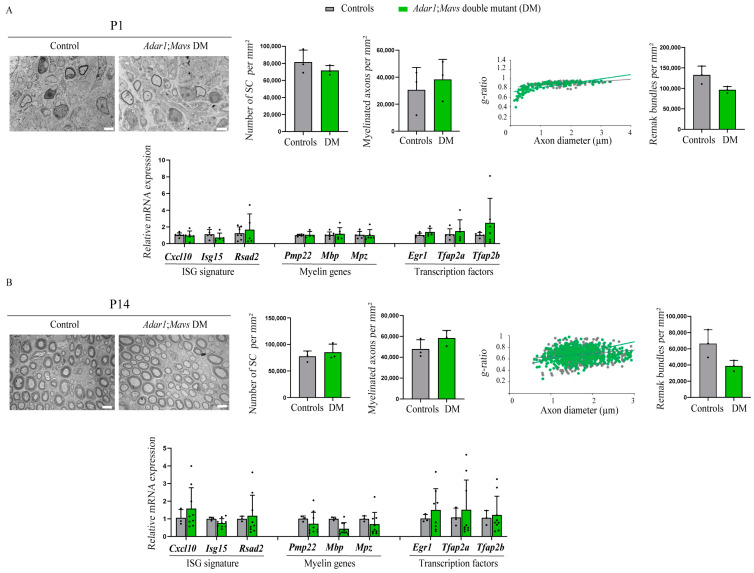
Figure 4.
Axon myelination and normalized expression of Egr1, Tfap2a, and Tfap2b in the sciatic nerves of Adar1;Mavs DM versus the controls. Electron micrographs of transverse sections of sciatic nerves from AdarΔ2−13/Δ2−13;Mavs−/− double mutant (Adar1;Mavs DM) mice at P1 (A) and P14 (B), showing the presence of myelin in double mutants compared to the controls (AdarΔ2−13/+; Mavs −/−, or Adar1+/+; Mavs−/−). Quantifications, presented as the mean ± SD, were performed on at least 5 EM images (means presented) from n = 3 controls and n = 3 mutants at each stage to count the Schwann cell number, myelinated axon number, Remak bundles per square millimeter, and g-ratio in the controls (grey) and Adar1;Mavs DM (green), as described in [40]. Statistical differences between the groups were determined using the t-test. Scale bar: 5 µm. The lower halves of panels (A,B) show the expression of the ISG (ISG signature composed of Cxcl10, Isg15, Rsad2) of transcripts encoding myelination proteins (Pmp22, Mbp, and Mpz), and of Egr1, Tfap2a, and Tfap2b in the sciatic nerves of the controls (grey) and Adar1;Mavs DM (green) at indicated stages. Statistical analyses were made between the groups (n = 4 controls and n = 7 DM at P1 and n = 3 controls and n = 3 DM at P14). Statistical differences between the groups were determined using the t-test.

