Figure 5.
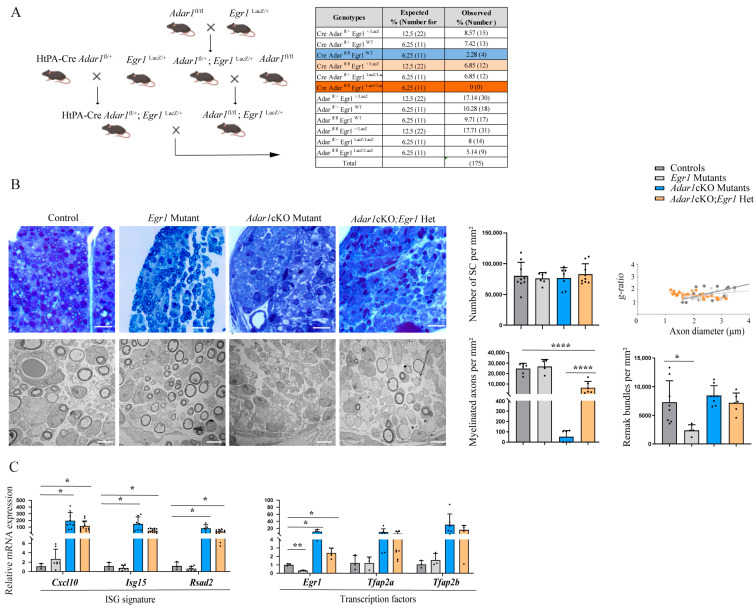
Deletion of one copy of Egr1 rescues Adar1cKO myelination defects in vivo. (A) Breeding strategy used to generate HtPA-Cre; Adar1fl/fl; Egr1LacZ/LacZ (Adar1cKO;Egr1 DM), HtPA-Cre; Adar1fl/fl; Egr1LacZ/+ (Adar1cKO;Egr1Het), single mutants, and the controls. The percentage (%) and expected number of animals of each genotype versus those collected between P1 and P14 are presented in the table. Comparison to the expected number was performed using the chi-square test to measure the significance of the deviation from Mendelian expectations (and to estimate the percentage survival of each genotype). This test revealed that the two sets of data, the observed and expected values, were different p = 0.00006711. (B) Semi-thin and electron micrographs of transverse sections of sciatic nerves from the controls (grey), Egr1 (light grey) and Adar1cKO (blue) single mutants, and HtPA-Cre; Adar1fl/fl; Egr1LacZ/+ (Adar1cKO;Egr1Het, orange) at P4. Quantification was performed by counting the number of Schwann cells, myelinated axons, and Remak bundles per square millimeter on two to six pictures of n = 3 animals per group and the g-ratio as described in [40]. Statistical differences between the groups were determined using the t-test (Asterisks represent p values: * p ≤ 0.05, **** p < 0.0001). Scale bar: 5 µm (EM) and 0.7 µm (semi-thin). (C) RT-qPCR, represented as the mean ± SD, were performed to quantify (i) Cxcl10, Isg15 and Rsad2, (ii) Egr1, Tfap2a, andTfap2b in the sciatic nerves of the controls (grey), Egr1 single mutants (light grey), Adar1cKO (blue), and HtPA-Cre; Adar1fl/f;Egr1LacZ/+ (Adar1cKO;Egr1Het, orange) relative to the controls. Note the partial myelin rescue in Adar1cKO;Egr1Het compared to Adar1cKO despite ISG signature activation and Tfap2a and Tfap2b overexpression. Statistical differences between the groups were determined using the t-test (asterisks represent p values: * p ≤ 0.05, ** p < 0.01).

