Figure 6.
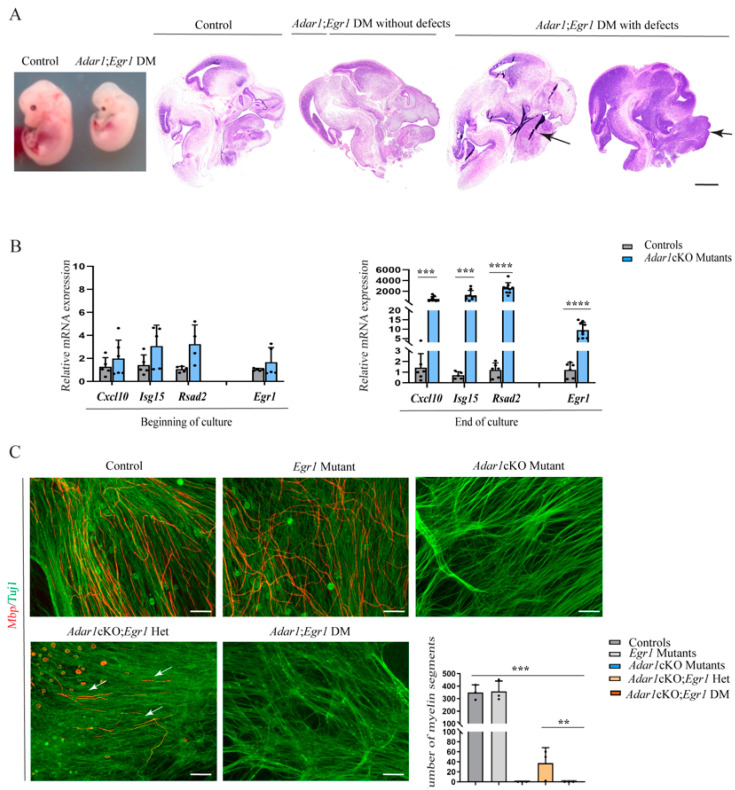
Craniofacial alterations and myelin defects in Adar1cKO;Egr1 DM E13.5 embryos. (A) photo of whole E13.5 Adar1cKO;Egr1 DM embryos versus sibling controls, and sagittal sections of E13.5 Adar1cKO;Egr1 DM embryos and controls stained with H&E showing examples of craniofacial alterations observed in 5 out of the 15 Adar1cKO;Egr1 DM (macroglossia and syngnatia are indicated with black arrows). Scale bar: 1 mm. (B) Relative expression of Egr1 and three ISG in the mRNA extracted from primary cultures of mixed neurons and Schwann cells from dorsal root ganglia (DRG) of the controls (grey) and Adar1cKO E13.5 embryos (blue) at the start and end of the culture. Statistical differences between the groups (n = 3 to 8) were determined using the t-test (asterisks represent p values: *** p < 0.001, **** p < 0.0001). (C) End-stage mixed embryonic DRG cultures established from the controls, Egr1 or Adar1cKO single mutants, Adar1cKO;Egr1Het and Adar1cKO;Egr1 DM embryos immunostained with Mbp and Tuj1 markers to visualize myelin segments (red) along sensory axons (green) at the end of the culture. Scale bar: 24 µm. Graph shows the quantification of the number of myelin segments per axons per well in n = 3 cultures established from the embryos of the indicated genotypes. Statistical differences between the groups were determined using the t-test (asterisks represent p values: ** p < 0.01 and *** p < 0.001).

