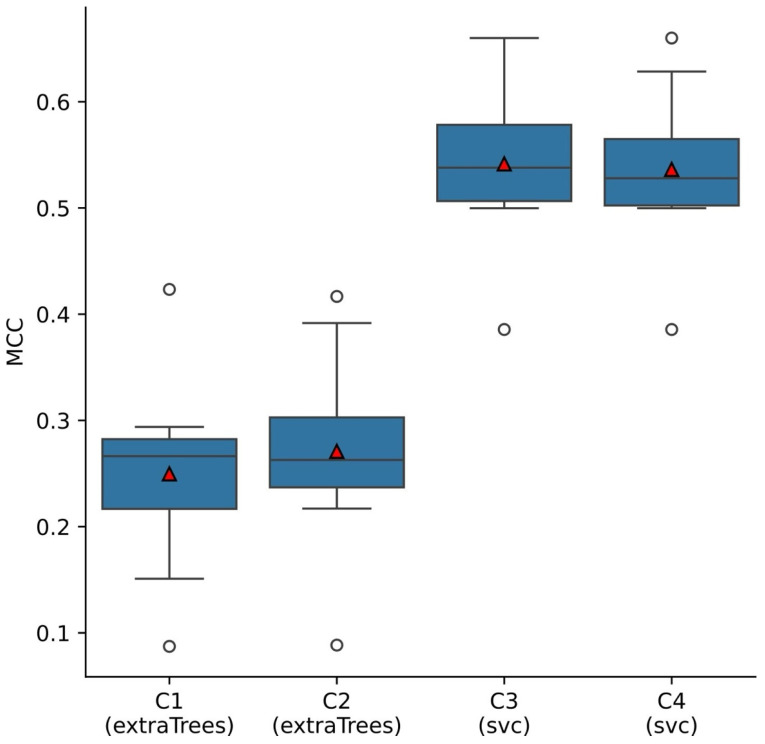
Figure 5.
Boxplots displaying the distribution of MCC scores for each type of machine learning model (Extra Trees Classifier, SVC) and input feature combinations (C1: volume and thickness of each ETDRS subfield, C2: C1 and BCVA, C3: C1 and clinical annotations, C4: C1, BCVA, and clinical annotations), across the ten iterations of the LSSO procedure. Black lines represent the median, red triangles the mean, whiskers 1.5× the interquartile range, and circles data points falling beyond 1.5× the interquartile range.

