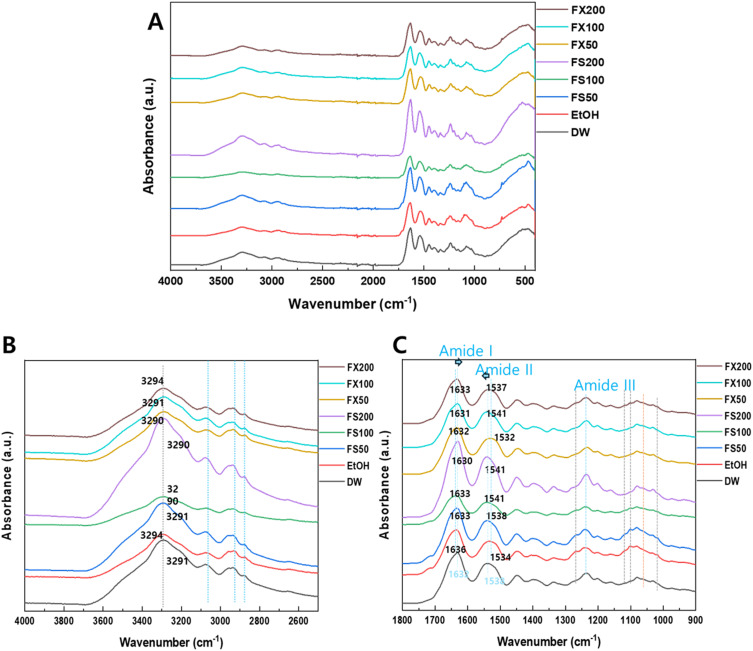
Figure 2.
FTIR spectra of demineralized dentin collagen after sample treatment with different ranges. (A) 4000–400 cm−1 (B) 4000–2400 cm−1 (C) 1800–900 cm−1. 50 µg/mL, 100 µg/mL, and 200 µg/mL FS and FX (FS50, FS100, FS200, FX50, FX100, and FX200 respectively).
Abbreviations: EtOH, Ethanol; DW, Deionized Water.

