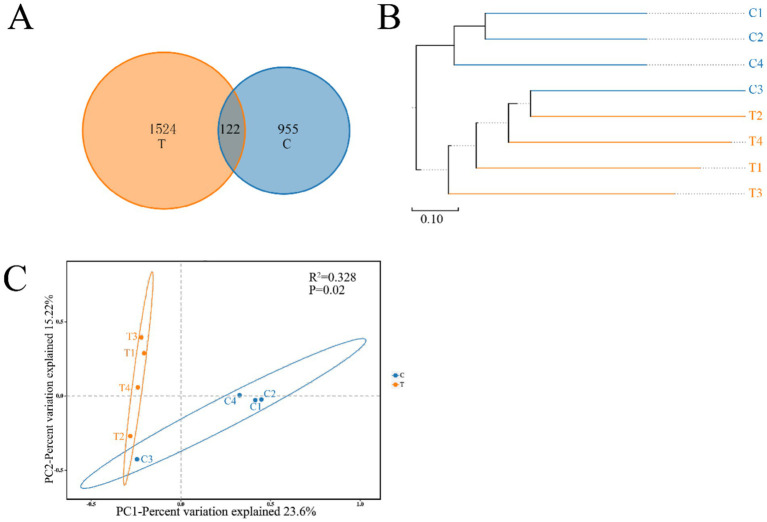
Figure 3.
Venn diagram analysis (A) depicting the numbers of shared and unique OTUs of mandarin fish gut microbial populations in different feeding groups (C and T). The beta diversity distance matrix (B) of gut bacteria samples was analyzed using hierarchical clustering, and a tree structure diagram was subsequently constructed using the UPGMA algorithm. PCoA (C) based on the weighted UniFrac distance of the gut bacterial communities of mandarin fish in different feeding groups (C and T). C, live fish feeding group; T, artificial feeding group.

